02 January 2021

A New Year, A New Lab -- libvirt and kvm

For years I have done the bulk of my personal projects with either virtualbox or VMWare Professional (all of the SANS courses use VMWare). Recently, a member of my LUG mentioned they'd dropped virtualbox some time ago in favour of using kvm with libvirt and virt-manager...since I'd never used kvm (or libvirt/virt-manager), I thought that was the perfect opportunity to redo my home environment.

The New Setup


When I first started OSG, I had just bought a MacBook Pro. As of macOS 11, that laptop is no longer supported - and I can't use a system that doesn't get OS updates. My options were to either buy a Windows 10 Pro licence or install Linux on it. Ubuntu 20.04 LTS (Desktop version) it was!

I'd also grown a bit tired of having to shuffle VMs between laptops and realised there are some REALLY good ways to solve that particular problem. Thanks to Amazon and too much time on my hands, I now have two 10th generation i5 Intel NUCs. Because more memory is better, each one has 64GB of RAM and a 500GB NVMe. Both are running Ubuntu 20.04 LTS as well, and I've opted to use their wired network interfaces rather than the wireless.

I did choose to install openssh-server, and install system updates, just after each system booted but otherwise all I've done is install Simple Screen Recorder, Chromium browser and the Scottish Gaelic language pack on the laptop.

In THIS post I'm going to focus on getting a new VM up and running on the laptop; I'll have a post in a few days about setting up the NUCs.

Step One - Install ISO


Since I'm setting up new VMs and replacing everything, I need the latest Ubuntu LTS server ISO:


For the last year I've been on a CentOS kick, so I have dozens of CentOS 7 and 8 servers, but with the uncertainty that has been introduced in that project...alas, that's for some other time, preferably over several pints of Belhaven Best.

Because I'm going to use the "Virt Manager" GUI on the laptop to create and manage KVM VMs, I'm only downloading the ISO on the laptop.

Step Two - libvirt and Virtual Machine Manager


With the ISO for the VMs downloaded, it's time to move to the fun part. On the laptop I'm going to install libvirt-daemon, libvirt-clients (which provides command line tools for working with libvirt) and virt-manager. KVM is built into the Linux kernel, libvirt just offers a way to interact with it (and with other tech, it's not a one-trick pony!). Since this is an Ubuntu system, I'll do it with "apt":

sudo apt install libvirt-daemon libvirt-clients virt-manager

the command "sudo apt install libvirt-daemon libvirt-clients virt-manager" and the output of apt displaying all of the additional packages to be installed

Depending on Internet speeds, now is a good time to go put the kettle on...

Step Three - the first VM


Once everything finishes installing, I'm going to move my Ubuntu Server ISO from my Downloads directory to the libvirt images directory, just because it's a standardised location for disk images (and because I don't really need it hanging out in my Downloads directory). I moved mine with:

sudo mv ~/Downloads/ubuntu-20.04.1-live-server-amd64.iso /var/lib/libvirt/images/

When it all finishes you can run "Virtual Machine Manager" by going to "Show Applications" and searching for it, or (as I am going to do) from the command line via:

virt-manager &

From here on, I'll just refer to that as VMM. When VMM starts up, there isn't much there - there are no VMs to monitor, so your display should look a lot like the screenshot below.


Don't worry, we're about to take care of that empty VM list =)

If you click "File", there's an option for "New Virtual Machine". This will begin the new VM wizard (yes, you can do all of this from the command line with virt-install - but that's another post!). I chose the following options:

VMM Step 1:
  - Local install media (ISO image or CDROM)

VMM Step 2:
  - Browse
  - select "ubuntu-20.04.1-live-server-amd64.iso"
  - click "Choose Volume"

VMM Step 3:
  - Accept the defaults (4GB RAM, 2 cores)

VMM Step 4:
  - Accept the defaults (25 GB disk)

VMM Step 5:
  - Changed name to u20-0

Note that to progress from step to step, you click "Forward" rather than "Next" or "Continue".

After a popup saying "creating domain" and the VM being made, things get to be a bit more exciting! Notice that a new VM shows up in the VMM window, with a status of "Running", and the same sort of display you'd get with VirtualBox or VMWare shows the install screen for the VM:

the "virtual machine manager" main window showing the new "u20-0" VM and it's status of "running"

the Ubuntu 20.04 text-based installer running in the new VM

From this point on, setting up the VM is just like any other Linux installation. I like to keep my installs REALLY simple so I usually accept all of the defaults for my test VMs. For this one, the only options I changed were:

o don't use LVM
o user is "demo"
o server name is "u20-0"
o install openssh-server

Once the install is finished, I select "reboot" and wait for things to reboot...


Notice the second icon, the "i" below "Virtual Machine". That is an info tab that provides all the information about the VM we could want to know - data about the hypervisor being used, CPU/Memory/Disk/Network usage graphs, CPU/Memory allocations, all the info you'd expect to be able to find. That same data can be retrieved via the command line with tools like "virsh" (as I said earlier, that's another post =)).

At this point I have a new Ubuntu Server 20.04.1 LTS system up and running, just like I would have in VirtualBox or VMWare. By default it uses a NAT network and I'm *fine* with that on the laptop. On the NUCs I suspect I'll have a mix of NAT and bridged, with a mix of network ranges based on what the VMs will do.

Wrapping Up


On the whole, I don't find this to be any more difficult or onerous than using either VirtualBox or VMWare Workstation/Fusion - but let's be fair, these products are geared at totally different user groups. There is nothing stopping anyone from using KVM to run Windows and a few dev VMs on their Linux laptop but where it really shines is on a cluster of 64-core, 4TB RAM servers running a few hundred (or thousand) virtual machines. Considering AWS made the decision to move from Xen to KVM, maybe "a few thousand virtual machines" is missing a couple of zeroes on the end...

23 February 2019

Parallelising Python: What Happens When a Beginner Discovers Multiprocessing

Some of you will remember that I have a few scripts that can be used for incident response in G Suite environments, available at:


For small environments they work great. Need to see if users received a specific malicious email? No problem. Need to move a message with a specific sender and subject from Inboxes to SPAM? You're covered. You can even delete messages that match specific criteria!

Therein is part of the problem. They're intended for fairly small environments, where you can search through mailboxes sequentially and view results on screen. I've recently been dropped into an environment where, instead of searching 100 - 1000 mailboxes, I need to search *100,000* mailboxes. That is a completely different scale than what I'd designed and implemented. How in the world do I search through 100k mailboxes when it takes at least a second to search *one*?

A Little Bit About Threads


My first thought was, "computers have several cores per CPU, why not use multiple threads?".

Those of you who know a little something about python and the Global Interpreter Lock are, right about now, probably saying, "oh you sweet summer child..."

When I started digging, I found out that threads in python don't actually take advantage of multiple cores and aren't what you might call "thread-safe" because of cpython implementations. I'm sure I screwed that up but the important thing here is: using python threads won't use some percentage of all of your cores but they CAN be used to get 100% out of one core.

That's when I learnt about the multiprocessing module. That *does* allow you to create multiple processes (child processes) from a program and use all of the cores in your system. And, as it turns out, it's not terribly difficult to use. 

A Sample Program


My requirements, overall were pretty simple:
  • get a list of users
  • for each user, make a network API call to Google
  • depending on the API results, write output to file

Since I can't afford to create a 100,000-person Google environment, I decided to cheat a little. Instead of making an API call, I would introduce a 0.25-second sleep. Then, I would have every iteration write to file. This wouldn't exactly account for waiting for the API call to finish but it would give me a starting point.

I also knew I didn't want to start with testing 100,000 iterations so I wanted to start with 100 iterations - at least until I had a grasp on how everything worked together!

The following was my starting point:

def make_input():
  l = []
  for i in range(65, 91):
    l.append(chr(i))
  for i in range(97, 123):
    l.append(chr(i))
  for i in range(65, 90):
    l.append(chr(i) + chr(i+1))
  for i in range(97, 122):
    l.append(chr(i) + chr(i+1))
  return list(l)

def do_stuff(a_list):
  import time
  for i in a_list:
    time.sleep(.25)
    print("in do_stuff: %s" % i)

# create a list of all upper and lowercase letters (for length)
letter_list = make_input()
# work_list is letter_list broken into a separate list per process
work_list = []
for i in range(len(letter_list)):
  work_list.append(letter_list[i])
do_stuff(work_list)
print("done")

This creates a list of 102 items (all letters upper and lowercase a-z, then upper- and lowercase tuples "ab" - "yz"). This would approximate getting a list of users.

It then iterates through that list to create another list of work tasks. My intent was to approximate having one process with x number of items to process - basically one process with one thread processing a bunch of stuff. The utility of the work_list list will become more evident in just a moment.

Then it passes a reference to the work_list list to the do_stuff function; this function iterates through the list it receives, performing a 0.25-second sleep per iteration. Basic arithmetic tells us that it should take approximately (0.25 seconds * 102 items) 25 seconds to run. Using "time" to call it, I can verify that it finishes in approximately 28 seconds.

Add Multiple Processes


The next step was to pick an arbitrary number of processes to use to process the list of letters/tuples and see how that affects the runtime. Since I'm weird and have an obsession with multiples of the number four, I chose four processes. This is work work_list really comes into use: since I want to have four processes working on approximately the same number of items, work_list is a list of four lists and THOSE lists each contain approximately 1/4 of the letters/tuples to process. In this way I have divided the work into four buckets and can just assign one bucket per process!

The sample code to achieve this looks like:

import multiprocessing
from threading import Thread

def make_input():
  l = []
  for i in range(65, 91):
    l.append(chr(i))
  for i in range(97, 123):
     l.append(chr(i))
  for i in range(65, 90):
     l.append(chr(i) + chr(i+1))
  for i in range(97, 122):
     l.append(chr(i) + chr(i+1))
  return list(l)

def do_stuff(*a_list):
  import time
  for i in a_list:
    time.sleep(.25)
    print("in do_stuff: %s: " % i)

num_procs = 4
# create a list of all upper and lowercase letters (for length)
letter_list = make_input()
# work_list is letter_list broken into a separate list per process
work_list = [list() for i in range(num_procs)]
for i in range(len(letter_list)):
  offset = i % num_procs
  work_list[offset].append(letter_list[i])
# for each list of letters, make a new thread where each one is the distribute function
proc_list = []
for i in work_list:
  process = multiprocessing.Process(target=do_stuff, args=(i))
  proc_list.append(process)
for i in proc_list:
  i.start()
for i in proc_list:
  i.join()
print("done")

The real magic is done with the proc_list list. It creates a process for each list in work_list; on the first iteration through proc_list we call "start()" to start those processes and then the next iteration says "wait for each process to finish before continuing". Since the only operation being performed is a quarter-second sleep, each process should finish in about the same amount of time. This is the equivalent to having four processes and each process having one thread.

Since I'm breaking the work into four separate processes, I would expect it to finish in about 1/4th the time of the previous code. Sure enough, if I time it with "time" (time python3 my_script.py), I see it completes in just under 8seconds. That's a huge improvement over 28 seconds!!

Moar Parallelisation


Using multiple processes will take advantage of modern systems with lots of cores but now I want to go a step further and have each process create multiple threads - so not only can I have each core do a _little_ work, I can have each core do a *lot* of work!

With some modification, I have renamed do_stuff() to make_the_threads(). It then creates a Queue (first in, first out) of threads, and each thread calls a function called do_per_thread_work(). The alternative is to run threads as batches but then each batch would be slowed to the slowest worker in that batch. By using a queue, as soon as one thread finishes another thread starts and python makes sure there are never more than <x> number of threads running per process. That removes a LOT of overhead and keeps things moving smoothly.

The code to do this looks like:

import time
import threading
import multiprocessing
from queue import Queue

def make_input():
  l = []
  for j in range(1):
    print(j)
    for i in range(65, 91):
      l.append(chr(i))
    for i in range(97, 123):
      l.append(chr(i))
    for i in range(65, 90):
      l.append(chr(i) + chr(i+1))
    for i in range(97, 122):
      l.append(chr(i) + chr(i+1))
  return list(l)

def do_per_thread_work(q):
  out_list = []
  while True:
    a_thing = q.get()
    time.sleep(0.25)
    q.task_done()

def make_the_threads(*a_list):
  global thread_count
  q = Queue(maxsize = thread_count )
  q.qsize()
  for i in range(thread_count):
    t = threading.Thread(name="do_per_thread_work-"+str(i), target=do_per_thread_work, args=(q,))
    t.start()
  for i in a_list:
    q.put(i)
  q.join()

num_procs = 4
thread_count = 5
thread_list = [list() for i in range(num_procs)]
# create a list of all upper and lowercase letters (for length)
letter_list = make_input()
# thread_list is letter_list broken into a separate list per process
for i in range(len(letter_list)):
  offset = i % num_procs
  thread_list[offset].append(letter_list[i])
jobs = []
for i in range(num_procs):
  process = multiprocessing.Process(target=make_the_threads, args=(thread_list[i]))
  jobs.append(process)
for i in jobs:
  i.start()
for i in jobs:
  i.join()
print("done")

If I use some arbitrary numbers, such as four processes with five threads per process, I would expect the program to finish VERY quickly - instead of running for 28 seconds, I would expect it to finish in about 2 seconds -- 102 items, spread across 4 processes, 5 threads per process, then 0.25 seconds per thread. Using "time", I can verify that and the above code runs in just under 2 seconds.

Notice I've also added a loop in the input creation so I can begin to test arbitrarily long lists of letters/tuples. For example, if I wanted to test a list of 1000 (-ish) items, I can just increase the loop from 1 to 10. At 1000 (1020) items, I'd still expect the script to finish in about 20 seconds and I can verify that with time. Indeed, the above code runs on my system in about 15 seconds.

Some Closing Thoughts


This is just scratching the surface of parallelisation but it does a great job of showing how *some* workloads can benefit from multiple processes and/or threads. For my workload, massive parallelisation is a Good Thing because each thread is just making an HTTPS request and waiting for the result, then writing those results to file. My bottleneck is network IO and each thread will spend most of its life in a WAIT state, so creating hundreds of them may be beneficial. 

This does NOT imply that ALL workloads will benefit from parallelisation! If each thread were performing heavy processing tasks, where the performance of the core itself were the bottleneck, then multiple processes but only one thread per process may be beneficial. If the bottleneck were, for example, disk IO, then the workload may not benefit from multiple threads OR multiple processes because a single process/thread may be enough to completely thrash the disk.

While it can have really cool results, it may be overkill to do a lot of multi-process/thread work unless you are sure your program will benefit from it. As a friend once told me, "don't optimise before the thing works"...but I can say that my search time for 100k mailboxes has dropped from about nine hours to about forty-five minutes and I'm pretty sure I can cut that in half again by adding two more cores to the system I'm using for search.

04 November 2018

Enriching Logs With Active Directory Attributes

Date of writing: 4th November 2018
Last edit: 4th November 2018

JUST GIVE ME THE SCRIPT AND CONFIG


If all you need are the logstash configuration and script to generate the translate data, go here:

https://github.com/kevinwilcox/python-elk

It is in the directory called "crawl_ad_ldap"!

Everyone Else 8^)


I recently tweeted about something that popped up in my day job and promised a bit more detail in a blog post. It has sort of worked out "to the good" because I've mentioned wanting to cover enrichment with AD info before but this really pushed that into overdrive...so here we are!

The Problem


When I talk to folks about what they're logging, and why they want to use something like Elastic, Splunk, GrayLog, etc., there are a few log types that regularly pop up.  It seems like everyone wants to pull login logs, be they 4624 events in Windows or SSH logins from the *nix world (I know, OpenSSH has been ported to Windows).  Both of these use pretty well-defined formats -- even though openssh logs to auth.log (generally) and uses syslog (generally), the format of an SSH success or failure is pretty consistent.

For the purpose of this post, we're going to focus on one field that's common to both Windows 4624 events and SSH authentications - the username field.

Let's make things a bit "real life".  Think about the scenario where you want to search for every login to a system in Human Resources, or for every login by a user in Finance and Payroll.  You would need to pull every login over <x> time period, do an OU lookup for every workstation name or username and then discard anything not in the OU you care about, or you'd need to pull a list of each user in those specific OUs and look for logins for those users. Those methods are pretty traditional but I was 100% sure there's a better way using modern tools (specifically, using my SIEM of choice - Elastic).

Method One - Elasticsearch


My initial solution was to use python to crawl Active Directory and LDAP for all computer and user objects (and the properties I need), cache that data locally in Elasticsearch and then query for the relevant data each time logstash parses or extracts a username field.  By doing that I can somewhat normalise all of my login logs - and then it doesn't matter if I know what all of the OUs or groups are in my organisation, or who is a member of which one, as long as I have mostly-current information from AD and LDAP.

I figured I already did this with OUI info for DHCP logs and Elasticsearch was performing great so doing it for username fields shouldn't be a big issue, right?  I'd just finished writing the python to pull the data and was working on the filter when I had a chat with Justin Henderson, author of the SANS SEC555 course, and he completely changed my approach.

Method Two - Translate


Justin recommended I try the translate filter.  I already used the filter for login logs to add a field with the description for each login type so I wasn't completely new to using it but I had never used it with a dictionary file.  After chatting with him and reading the documentation for a bit, I realised I could create a dictionary file that looked like this:

username_0:
  distinguished_name: username_0, ou=foo, ou=foo2, ou=org, ou=local
  member_of:
    - cn=foo
    - cn=another_foo
    - cn=yet_another_foo
username_1:
  distinguished_name: username_1, ou=foo3, ou=foo4, ou=org, ou=local
  member_of:
    - cn=foo3

Then any time logstash see username_0 in the "username" field, it can add the distinguished_name and member_of fields to the metadata for that log.

The operative word being "could"...I'd still have a bit of work to go from that idea to something I could roll out to my logstash nodes, especially since they run on BSD and Linux where there isn't exactly an option to run "get-aduser".

A First Pass


The AD controller I used for this post is configured to use osg.local as its domain. I've added an OU called "osg_users" and that OU has two users, "testuser" and "charlatan".

"charlatan" is also a member of a group called "InfoSec" and "testuser" is member of a group called "Random Group".

First, I needed to setup a configuration file so I could put directory-specific information in there. The one I wrote for this blog is named conn_info.py and looks like this:

ad_server = "IP_of_AD_controller"
ad_search_user = "osg\charlatan"
ad_search_pass = 'charlatans_password'
ad_search_base = "ou=osg_users,dc=osg,dc=local"
ad_search_props = ['displayname', 'distinguishedname', 'memberof']

Ideally the charlatan user/password would be a service account but it works for this example.

You may assign any manner of properties to the users in your AD or LDAP but displayName, distinguishedName and memberOf are practically universal.

The next step was a script that could connect to and interrogate my AD server.

A really basic script using the ldap3 module and my conn_info.py file might look like this:

#!/usr/bin/env python
from ldap3 import Server, Connection, ALL, NTLM
import conn_info
server = Server(conn_info.ad_server, get_info=ALL)
conn = Connection(server, conn_info.ad_search_user, conn_info.ad_search_pass, auto_bind=True, auto_range=True)
print("starting search...")
try:
  searchString = "(objectclass=user)"
  conn.search(conn_info.ad_search_base, searchString, attributes=conn_info.ad_search_props, paged_size = 500)
  for entry in conn.entries:
    print(str(entry))
  cookie = conn.result['controls']['1.2.840.113556.1.4.319']['value']['cookie']
  while(cookie):
    print('receiving next batch')
    conn.search(conn_info.ad_search_base, searchString, attributes=conn_info.ad_search_props, paged_size = 500, paged_cookie = cookie)
    for entry in conn.entries:
      print(str(entry))
    cookie = conn.result['controls']['1.2.840.113556.1.4.319']['value']['cookie']
    print('searches finished')
except Exception as e:
  print("error")
  print(e)
exit("exiting...")

Let's step through that a bit. ldap3 is a fantastic module for interrogating AD and LDAP and it works with both python 2 and python 3. Importing conn_info makes sure we can read variables (I know, constants, and they should be in all caps) from the conn_info.py file. The next few lines connect to the AD server; the auto_bind option saves a step by binding to the server after connecting as the specified user.

Unless the directory configuration is modified, most objects in AD will probably be of either type "user" or type "computer".

"paged_size" is an interesting attribute in that it will limit the results to 500 at a time, then the cookie is used to paginate through to the last result set (hence the "for" loop).

This script doesn't produce output that's useful to logstash but it is really useful to us as people. For my example DC, I get this:

(ldap_post) test@u18:~/ad_ldap_post$ python test.py
starting search...
DN: CN=Just A. Charlatan,OU=osg_users,DC=osg,DC=local - STATUS: Read - READ TIME: 2018-10-15T00:32:44.624881
    displayName: Just A. Charlatan
    distinguishedName: CN=Just A. Charlatan,OU=osg_users,DC=osg,DC=local
    memberOf: CN=InfoSec,DC=osg,DC=local
DN: CN=Testing User,OU=osg_users,DC=osg,DC=local - STATUS: Read - READ TIME: 2018-10-15T00:32:44.625089
    displayName: Testing User
    distinguishedName: CN=Testing User,OU=osg_users,DC=osg,DC=local
    memberOf: CN=Random Group,DC=osg,DC=local
exiting...

Notice how similar this output is to doing:

get-aduser -searchbase "ou=osg_users,dc=osg,dc=local" -filter * -properties displayname, distinguishedname, memberof

Making it More Useful


The real goal is to have something I can read into logstash. The translate module can read CSV, JSON and YAML and, for this purpose, in my opinion the cleanest to read is YAML. Instead of using a library to convert between object types and output YAML, I'm just going to output the YAML directly.

A sample function to make it easy to build the output might look like:

def format_output(user_entry):
  entry_string = str(user_entry['samaccountname']) + ":\n"
  entry_string += "  dn: " + str(user_entry['distinguishedname']) + "\n"
  entry_string += "  displayname: " + str(user_entry['displayname']) + "\n"
  entry_string += "  memberof: " + "\n"
  for i in user_entry['memberof']:
    entry_string += "    - " + str(i) + "\n"
  return entry_string

With a couple of minor edits, my output now looks like this:

charlatan:
  dn: CN=Just A. Charlatan,OU=osg_users,DC=osg,DC=local
  displayname: Just A. Charlatan
  memberof:
    - CN=InfoSec,DC=osg,DC=local
testuser:
  dn: CN=Testing User,OU=osg_users,DC=osg,DC=local
  displayname: Testing User
  memberof:
    - CN=Random Group,DC=osg,DC=local

It's important to have memberof output like that as default because as soon as you add users to two or more groups, that's how YAML parsers will expect them to be formatted.

The last step in the script is to write to file instead of outputting to the display. Stripping out the print statements and using file output instead, my script now looks like this:

#!/usr/bin/env python
def format_output(user_entry):
  entry_string = str(user_entry['samaccountname']) + ":\n"
  entry_string += "  dn: " + str(user_entry['distinguishedname']) + "\n"
  entry_string += "  displayname: " + str(user_entry['displayname']) + "\n"
  entry_string += "  memberof: " + "\n"
  for i in user_entry['memberof']:
    entry_string += "    - " + str(i) + "\n"
  return entry_string
from ldap3 import Server, Connection, ALL, NTLM
import conn_info
server = Server(conn_info.ad_server, get_info=ALL)
conn = Connection(server, conn_info.ad_search_user, conn_info.ad_search_pass, auto_bind=True, auto_range=True)
try:
  out_string = ""
  searchString = "(objectclass=user)"
  conn.search(conn_info.ad_search_base, searchString, attributes=conn_info.ad_search_props, paged_size = 500)
  for entry in conn.entries:
    out_string = out_string + format_output(entry)
  cookie = conn.result['controls']['1.2.840.113556.1.4.319']['value']['cookie']
  while(cookie):
    conn.search(conn_info.ad_search_base, searchString, attributes=conn_info.ad_search_props, paged_size = 500, paged_cookie = cookie)
    for entry in conn.entries:
      out_string = out_string + format_output(entry)
    cookie = conn.result['controls']['1.2.840.113556.1.4.319']['value']['cookie']
  out_fh = open('ad_users_file.yml', 'w')
  out_fh.write(out_string)
  out_fh.close()
except Exception as e:
  print("error: " + e)
exit()

When I run it, I have a new file created called "ad_users_file.yml". It looks like this:

charlatan:
  dn: CN=Just A. Charlatan,OU=osg_users,DC=osg,DC=local
  displayname: Just A. Charlatan
  memberof:
    - CN=InfoSec,DC=osg,DC=local
testuser:
  dn: CN=Testing User,OU=osg_users,DC=osg,DC=local
  displayname: Testing User
  memberof:
    - CN=Random Group,DC=osg,DC=local

This is ideal for logstash to use as a dictionary - now I can tell it if it ever sees "charlatan" in a field called "user" then add the information in my dictionary to those log files.

A Sample Logstash Config


Instead of testing with a Windows log or an OpenSSH log, I can have a really simple logstash "testing" config file that takes in user input in JSON format, looks up the information in a dictionary when it sees a field called "user" then sends the resulting object to the display.

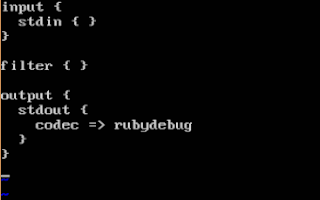
That "simple" configuration for logstash, which I'm naming ls_test.conf,  could look like this:

input { stdin { codec => json } }
filter {
  if [user] {
    translate {
      field                       => "user"
      destination             => "from_ad"
      dictionary_path     => "ad_users_file.yml"
      refresh_behaviour => "replace"
    }
  }
}
output { stdout { codec => rubydebug } }

Logstash can be started with a specific config file with:

sudo /usr/share/logstash/bin/logstash -f ls_test.conf

Once it's ready for input, if I use the following two objects then I get a good test of what happens if logstash both does and does not find my object in the dictionary:

{"user":"charlie"}
{"user":"charlatan"}

When I use them, I get the following output:

{"user":"charlie"}
{
      "@version" => "1",
          "user" => "charlie",
    "@timestamp" => 2018-10-15T02:10:06.240Z,
          "host" => "u18"
}
{"user":"charlatan"}
{
      "@version" => "1",
          "user" => "charlatan",
    "@timestamp" => 2018-10-15T02:10:14.579Z,
          "host" => "u18",
       "from_ad" => {
                 "dn" => "CN=Just A. Charlatan,OU=osg_users,DC=osg,DC=local",
        "displayname" => "Just A. Charlatan",
           "memberof" => [
            [0] "CN=InfoSec,DC=osg,DC=local"
        ]
    }
}

This is exactly what I'd expect to see. Having everything under the "from_ad" field may not be ideal, I can always use a mutate statement to move or rename any field to a more "reasonable" or "usable" place.

Wrapping Up


This is an enrichment technique that I really like and that I recommend implementing anywhere possible. It's also really flexible! I know I've written about it in the context of Active Directory but it's really in the context of any LDAP - Active Directory just happens to be the one folks tend to be familiar with these days. Want to search something by username? Great, here you go! Need to search the rest of your logs and limit it to only members of a given OU? No more waiting for your directory to return all of those objects and search for those, no more retrieving all of your logs and waiting while your SIEM looks for them one-at-a-time in a lookup table *at search time* with potentially out-of-date information - it's all added when the log is cut with the most current information at the time!

14 July 2018

Enriching Domain Names with Frequency Analysis and ASN Information

I saw a really interesting question on Twitter today.  Someone asked if there were an IP/whois plugin for ELK so that folks could add ASN information to log data.  I thought that question was just perfect because I've spent a lot of time lately talking to folks about the importance of log enrichment and how to do it with logstash (for example, see the SANS webcast Justin Henderson and I did: https://www.sans.org/webcasts/high-fidelity-alerts-context-context-107870).

Since the question was specifically about ASN information, we're going to take a look at the "geoip" filter to get information about an IP.  Since I like DNS enrichment, I'm going to use the "dns" filter to get information about a hostname and then we're going to look at a Mark Baggett tool called domain_stats to get whois information - specifically, the creation date of the domain.  Since it runs as a web service, you can use logstash's "rest" filter to query it from inside your configuration!

That got me thinking about another Mark Baggett tool called "freq_server".  Have you ever looked at a domain name and thought, "there's no way a human being created that, it had to be an algorithm..."? Generally speaking, in the English language, some letters come after others a LOT more frequently than some other combinations.  For example, in English, if we see the letter 'Q' then it is followed by the letter 'U' much more frequently than it is followed by the letter 'J'.  If I see a domain name that has 'qj' in it then that is much more interesting (*very* generally speaking) than a domain name that has 'qu' in it.  Mark's tool looks at those tuples and returns a score based on how frequently the letter combinations in a given word fit with the English literature used to "train" it - and it runs as a web service, too, so we can query it with logstash's "rest" filter as well!

The Environment


My environment is Ubuntu Server 18.04 LTS with logstash 6.3.1 installed per the instructions here:


The "rest" filter is not installed by default but it is available for the latest version of logstash.  You can install it with:

sudo /usr/share/logstash/bin/logstash-plugin install logstash-filter-rest

Both of Mark's tools are written with python2.7 in mind so I've installed python2.7 and pip via apt:

sudo apt install python python-pip

And then I've added python-whois via pip:

sudo pip install python-whois

One quick word: ordinarily I would use something like virtualenv for this.  There is absolutely no reason not to do that right now other than I'm destroying this VM when I'm done tonight.

Getting domain_stats and freq_server


Both of the tools I'm using for enrichment, domain_stats.py and freq_server.py, are available from Mark's GitHub:


I have the latest version of each from GitHub using "git clone <above_url>", so I have a directory called domain_stats and another called freq.

The easiest way to run domain_stats.py (remember, it starts a web server!!) is to cd to the domain_stats directory and just run it as a backgrounded python process.

cd domain_stats
python domain_stats.py 10000 &

This starts domain_stats on port 10000.

I'm going to do the same thing for freq_server.py except I want it on port 20000. It doesn't matter which port you run them on (as long as it's a free port above 1024!). In production I would use a service and set the owner/group to logstash but for this demo, it's sufficient. Notice that freq_server takes a frequency table as its final option -- Mark provides one at the GitHub page!

cd freq
python freq_server.py 20000 freqtable2018 &

You should get something saying the server is ready and an example of the URL to use to query it.

First Logstash Config


I am starting with a VERY simple logstash config file, called "test.conf", in my local directory. My initial config looks like this:

input { stdin { codec => json } }
filter {
  if [message] == "" {
    drop { }
  }
}
output { stdout { codec => rubydebug } }

Basically this lets me type in a JSON object as input and it parses the fields and prints it as a formatted JSON object. The filter block lets me hit enter a few times without throwing a parse error or printing an object for null input by telling logstash to just drop those events instead of displaying them.

I'm starting logstash with:

sudo /usr/share/logstash/bin/logstash -f test.conf

For the entire blog post, I'm going to use a simple example log entry of:

{"host":"google.co.uk"}

With my existing logstash configuration, I get something like this:


Notice that because I told logstash to expect JSON as input, and because I gave it a JSON object as input, it parsed out the "host" field for me.  This will be really important later.

The First Enrichment: DNS


The very first thing we need to do is go from a hostname to an IP address.  In a "real" environment you'd have something like passive DNS information or netflow so you may already have an interesting IP address.  I still like letting my enrichment boxes do DNS lookups, though, because I find it interesting if I see one domain looked up ten times in two minutes and the results are for vastly different ASNs (warning warning warning!! that could be malware using fast flux DNS!).

To use the filter, I'm going to add a "filter { }" section to my test.conf file that looks like this:

filter {
  if [host] {
    dns {
      resolve => "host"
      action => "append"
    }
  }
}

This will do a lookup for whatever is in the "host" field and then *append* it to the host field, effectively turning it into an array.  If I use my new config, my result looks something like this:


Move the IP With Mutate


I think that's a little difficult to deal with later because I don't like arrays in my config files.  The easiest way to solve that wee issue is to use the "mutate" filter to rename fields into something more useful.  I want to break the IP address into its own field, resolved_ip, and keep the hostname in its own field, host.  With a little work, my filter now looks like this:

filter {
  if [host] {
    dns {
      resolve => "host"
      action => "append"
    }
    mutate {
      rename => {
        "[host][1]" => "resolved_ip"
        "[host][0]" => "host"
      }
    }
  }
}

When I run the new config, I get this:


Much easier to read (and definitely easier to use later!!).

Next Enrichment: geoip


Now that I have an IP address, I can answer the question that prompted this post - which ASN is assigned the IP in question!

There are two ways to use the built-in geoip filter.  The first adds city/state/country information, the second adds ASN information.  You can't add these with a single block, you have to call geoip twice, so I'm going to add a new filter block that looks for "resolved_ip" and, if its present, calls geoip twice.

filter {
  if [resolved_ip] {
    geoip {
      source => "resolved_ip"
      target => "geoip_city"
      default_database_type => "City"
    }
    geoip {
      source => "resolved_ip"
      target => "geoip_asn"
      default_database_type => "ASN"
    }
  }
}
This adds a *considerable* amount of information to the log event!


The most important fields, generally speaking, are the geoip_asn[asn] and geoip_asn[as_org] fields.  Microsoft, for example, may have some 20 million IPs across multiple CIDR blocks, but I don't need to know what each block is - I just need to know to look for "Microsoft" as the as_org.  With mutate I could rename any of these fields to make searching easier.

Using REST With domain_stats.py


In day-to-day Internet usage, it is rare to see people visiting domains that are "new".  Sure, the occasional start-up makes a name for themselves or a site takes off practically overnight but that is not the norm.  If I see domains that are only a few days or weeks old, I find that *REALLY* interesting.  It may not be the sole reason to alert on a given domain but it certainly can contribute towards me taking a second look at one.

Now that I have domain_stats running, I can query it for information using the "rest" filter.  To do so, I'll add the following filter block to my test.conf:

filter {
  if [host] {
    rest {
      request => {
        url => "http://localhost:10000/domain/creation_date/%{host}"
      }
      sprintf => true
      json => false
      target => "creation_date"
    }
  }
}

This tells it to query the service running on port 10000 on the local machine using the URL that tells domain_stats to return the creation date for the hostname in [host].  It then stores that information in "creation_date":


Note the addition of the "creation_date" field - Google's UK domain has been around for quite a while, almost 20 years!

Final Enrichment: Using REST With freq_server


The final enrichment I'll add is the frequency analysis.  This assigns a numeric value between 1 and 35 (configurable) depending on how "randomly" the letter sequences appear - the smaller the number, the more likely the domain is the product of a Domain Generation Algorithm.  Because it uses the rest filter, the final "filter" block to be added will look a lot like the block for domain_stats:

filter {
  if [host] {
    rest {
      request => {
        url => "http://localhost:20000/measure/%{host}"
      }
      sprintf => true
      json => false
      target => "freq_score"
    }
  }
}

With that added, my final output looks like this:


The "freq_score" value has two different values based on a recent code update and using two different algorithms.  You can use whichever value you prefer but be consistent with whether you want the first or second one.  I'll leave it to you to determine how to extract the values but grok, dissect or ruby would be viable starting points...

Wrapping Up


I really like the performance of Elasticsearch but for me, the *best* thing about the Elastic stack is logstash.  To be able to take a single domain name or IP address and produce a log event, in real time, that has whois, GeoIP, passive DNS and anything else you can think of, is a MASSIVE win in my opinion.

To make things easier, here is the full content of my config file:

input { stdin { codec => json } }
filter {
  if [message] == "" {
    drop { }
  }
}
filter {
  if [host] {
    dns {
      resolve => "host"
      action => "append"
    }
    mutate {
      rename => {
        "[host][1]" => "resolved_ip"
        "[host][0]" => "host"
      }
    }
  }
}
filter {
  if [resolved_ip] {
    geoip {
      source => "resolved_ip"
      target => "geoip_city"
      default_database_type => "City"
    }
    geoip {
      source => "resolved_ip"
      target => "geoip_asn"
      default_database_type => "ASN"
    }
  }
}
filter {
  if [host] {
    rest {
      request => {
        url => "http://localhost:10000/domain/creation_date/%{host}"
      }
      sprintf => true
      json => false
      target => "creation_date"
    }
  }
}
filter {
  if [host] {
    rest {
      request => {
        url => "http://localhost:20000/measure/%{host}"
      }
      sprintf => true
      json => false
      target => "freq_score"
    }
  }
}
output { stdout { codec => rubydebug } }

21 January 2018

SIEM From Scratch: Custom Data With Python

This was a bit of an unexpected post for me to make. When I laid out all of the "SIEM From Scratch" posts I wanted to do, I fully expected to use use filebeat and syslog to get data from endpoints. If I have programs (or scripts...) that query for data via an API, such as my previous post about getting logs from Google, I typically run those on a schedule via cron and then import that data into ELK via filebeat. I can write each login event as a JSON object so, really, why would I NOT do that?

Then this week I was at work and was bitten, a bit harder than I found comfortable, by an inode re-use issue with Linux and filebeat and that got me to thinking (I know, how problematic is *that*?!)...

For the impatient curious - the ultimate solution was to create the new file and have filebeat pick it up, then delete it after <x> number of minutes so that it drops out of the filebeat registry before the new file is created. This lets me avoid fiddling with filebeat options and I can control it all from my script (or with cron).

The Issue - inode Re-Use


Before I go into a possible solution, allow me to outline the problem. Filebeat is amazing for watching text files and getting them into the Elastic stack - it has all the TLS and congestion-control bells and whistles, plus it lets you do some interesting things on the client if you're reading JSON files. To make sure it gets your data (and doesn't get your data twice), it has a registry file that makes note of which byte it just read in your file. To know that it's your file, it also keeps track of the name, the inode and the device on which that file resides.

The important part here is the concept of an inode.

Without getting too "into the weeds", an "inode" is a way to address where a file starts on a hard drive. An analogy would be your home. If you want to invite someone over, you give them your address. The equivalent for a file or directory may be its path -- "/var/log/syslog" or "C:\Windows\system32", for example.

However, you could ALSO give them your GPS coordinates. Even if your address changes, your GPS coordinates would remain the same. The equivalent for a file in POSIX-compliant operating systems is an inode number. Just like giving someone your GPS coordinates is kind of a pain, trying to remember inode numbers is a bit of a pain. This is why we don't really use them in day-to-day work but we use filenames and paths all the time. One is really easy for people to remember, one is really problematic.

If the town/city/village/whatever renames your street then your address will change, even though your home didn't move - therefore your GPS coordinates won't change. Likewise, if I rename my file from "my_file.txt" to "my_file2.txt", I'm just changing the path and the inode number remains the same. Here is the output of "stat" on FreeBSD. The second column is the inode number:


Here's where it gets really interesting. If I have a file called "my_file.txt", delete it and create a new file called "my_file.txt", the inode number may be the same - even though it's a completely new file with new information. Again, here is the output of doing that and of the 'stat' command:


Notice the inode number is the same for both files. If I have a program, like filebeat, that knows to watch "my_file.txt" with inode '348828', it may read the content of the original file ("hi") and store that it read <n> bytes. Then, even though I deleted the file and have *completely new data* in my new file, because the inode number is the same, it will start reading again at <n + 1> bytes. That means I will have a log entry of "hi" - and then another that says " someone else". Now my SIEM has missing log data!

One Solution - Write Directly to Logstash


This brings me to the fun part of this post - what to do when you really don't need an intermediary and just want to log something directly to logstash. I think Solaris may have been the Last Great Unix in some ways but there isn't a filebeat for Solaris and nxlog (community edition) is a bit of a pain to compile and install. That's okay because you can have something pick up a logfile and send it *as JSON* to your SIEM. Can't get a log shipper approved for install on <x> system but you need output from your scripts? That's okay because you can send that output directly to your SIEM!

Step One - Logstash Needs to Listen For a TCP Connection


The first step is to setup a TCP listener in logstash. I have logstash 6.1.2 installed from Elastic's "apt" repo and a config file, "test.conf", with just enough in it to be able to test input/output. The "stdin" input type tells logstash to accept from "standard input", in this case my keyboard, and print to "standard output", in this case my monitor. The "rubydebug" code tells logstash to make the output pretty so it's easier for a human to read:


And when I run logstash manually with that configuration using:

sudo -u logstash /usr/share/logstash/bin/logstash --path.config test.conf

I can confirm it works by hitting "enter" a couple of times and then typing in some text (I just wanted to show that it grabs lines where the only input is the "enter" key):


Logstash has a multitude of possible input types. For example, I have some logstash servers that accept syslog from some devices, un-encrypted beats from others, encrypted beats from still others, raw data over UDP from even more and, finally, raw data from TCP from yet *another* set of devices. There are a LOT of possibilities!

NB: logstash will run as the logstash user, not root, so by default it can NOT bind to ports lower than 1024. Generally speaking you want to use high-numbered ports so things "Just Work"!

For this post, I want to tell logstash to listen for TCP connections on port 10001 and I want it to parse that input as JSON. To do this, I add a "TCP" input section. I've also added a comment line above each section telling whether it was in the above configuration so you can more easily see the added section:


Since I'm already logged into that VM, I'm going to go ahead and restart logstash with my custom configuration using the same sudo command as above:

sudo -u logstash /usr/share/logstash/bin/logstash --path.config test.conf

Since I still have the section for stdin as an input, logstash should start and give me a message saying it's waiting for input from "stdin":


Now I'm going to move over to my FreeBSD VM that has python installed to write my test script.

Step Two - The Scripting VM


My development VM is running FreeBSD 11 and the only things I have done to it are add a user named 'demo' and installed pkg, vim-lite and python3:

adduser demo
pkg install pkg
pkg install vim-lite
pkg install python3

After logging in, I made sure I could run "python3" and get an interpreter (the ">>>" means it is ready for me to start entering python code):


To exit the interpreter, I can either type "quit()" and hit the enter key or I can hold down the Control key and press 'd'.

With that done, it's time to write my script!

Step Three - Python, JSON and Sockets


I am a very beginner-level python programmer - I know just enough about it to read a little of it, so don't be intimidated if you're new to it. We're going to keep things as basic as possible.

First I need to tell python that I'm either going to read, parse or output JSON. It has a native module for JSON called, appropriately enough, 'json', and all I need to do is "import" it for my script to use it as a library. It also has a module called 'socket' that is used for network programming so I want to include that as well.

import json
import socket

Next I want to build an item to use for testing. I'm going to name it "sample_item" and it's going to have a single field called "user_name". Since my user on the VM is named 'demo', I'm going to use 'demo' as the value for the "user_name" field:

sample_item = { 'user_name': 'demo' }

That's kind of a JSON object but not quite standards-compliant. To make sure it is exactly what I want, I am going to use the json.dumps() function to force it to be converted. Logstash expects each JSON object to be delineated with a newline character ("\n") so I'm going to add one of those to the end and I'm going to save all of that into a new variable called "sample_to_send":

sample_to_send = json.dumps(sample_item) + "\n"

Now I need to create a network connection to my logstash server. I know that it has an IP address of 192.168.1.8 because I checked it earlier, and I know that logstash is listening for TCP connections on port 10001 because I configured it that way. To open that connection in python is a multi-step process. First, I create a socket item that I call "my_socket":

my_socket = socket.socket(socket.AF_INET, socket.SOCK_STREAM)

Then I'm going to tell it to connect to the logstash server:

my_socket.connect(("192.168.1.8", 10001))

If that doesn't give an error then I'm going to try to write the test object, sample_to_send, to the socket. With python 3.x, sendall() takes a *bytes-like* object, not a string, so I need to use the encode() function -- by default it will encode to 'utf-8' which is just fine:

my_socket.sendall(sample_to_send.encode())

Finally I'm going to close my socket and exit the script:

my_socket.close()
exit()

Since I can run all of that in the interpreter, it looks like this:


Notice I didn't get an error after the "sendall()" function. Moving back over to my logstash VM I see that I have received something:


192.168.1.7 is indeed the IP address of my FreeBSD VM and my JSON object has been parsed by logstash!

Step Four - Save A Script and Add Another Field


Running things inside the interpreter is pretty handy for testing small things but I want to run this repeatedly so I'm going to save it all in a script. At that point I can do interesting things like add error checking, send multiple items in a loop, etc.

I'm going to name the script "test.py" and it will be pretty much exactly what I ran in the interpreter but with some blank lines thrown in to break it up for readability:


What if I want to add an email address for my user? How would that look? Well, it's just another field in the "sample_item" object (it's called a dictionary but dictionaries are objects...):

sample_item = { 'user_name': 'demo', 'email_address': 'demo@my-great-domain.com' }

In my script it looks like this (notice I've put the new field on a new line - this is purely for readability):


If I modify my script so that "sample_item" looks like the above and run it with "python3 test.py", I should see a new JSON object come in with a field called "email_address":


Sure enough, there it is!

Wrapping Up


This script is in pretty poor shape - for starters, it has zero error handling and it isn't documented. In a production environment I would want to do both of those things, as well as write out any errors to an optional error log on the disk. For now, though, I think it is a good starting point for getting custom data from a script to logstash without needing to rely on additional software like filebeat or nxlog. Never again will I have to look at custom log data sitting on a Solaris server and think, "you know, I'd like to have that in my SIEM but I don't know an easy way to get it there..."

There are some additional benefits, too. I don't *HAVE* to use python to send my events over. I could just as easily have sent data via netcat (nc) or via any other language that supports writing to a network socket (or, for that matter, just writing to file!). Bash even supports doing things like:

echo '{"user_name":"demo"}' > /dev/tcp/192.168.1.8/10001

It does not even need to be bash on Linux - I've tested it on both Linux and FreeBSD, and it even works on Windows 10 using the Windows Subsystem for Linux.

A slightly better-documented version of the script, and the sample logstash configuration, can be found at:

https://github.com/kevinwilcox/python-elk

30 December 2017

SIEM From Scratch: Getting Logs From Google

A SIEM should be able to consume, correlate and alert on data from multiple types of logs.  Google Apps (G Suite) and Microsoft 365 have been growing in popularity for years - almost everyone in my industry use one or the other - but I see very few resources publicly available for SecOps teams to get information from them.  Even worse, most of the InfoSec and SecOps teams in my industry that DO have visibility into their Google environments are stuck with the painfully slow Google web interface for search and have to go to their Ops teams for API stuff.  I have seen *hours* shaved off investigations by having Google login and access logs stored in a local SIEM, or at least searchable by the API, versus trying to pivot inside of the web interface.  In chatting with colleagues, though, I keep finding that very few use the API - or they have to rely on an external group for that type of search.

I want to change that by writing and releasing a set of scripts to search for specific types of logs, written on top of python3 and maintained against the latest version of the Google API, using the "readonly" scopes provided by Google.  My goal is to have a starting point for SecOps teams, a place where they can see how to get rolling with the API and then build off of my starter scripts to do interesting things that address the problems they face and are tailored to their environments.

Note: I stated I want to provide something small and light.  There is already a *comprehensive* solution to interacting with the Google API via the command line called GAM: https://github.com/jay0lee/GAM

Prerequisites - Google Service Account


Before you go any further, you're going to need a service account or oauth2 access token for your Google domain.  For most of us that will mean going to our Google admins and asking for an oauth2 credentials file.  Google offers a two-week test setup if you're interested in "G Suite"/"Google Apps for Business" so I moved one of my domains and dove into their account/IAM/token tools.

I'm not going to try to document how to create a service account, that could be its own post, but more information on how to generate one can be found in the Google documentation:


After the account is created, the oauth2 token (in JSON) should look something like this:


To keep things simple, I have named mine "client_secret.json".

The three scopes that need to be authorised for the purposes of this post are:


  • https://www.googleapis.com/auth/admin.reports.audit.readonly
  • https://www.googleapis.com/auth/admin.reports.usage.readonly
  • https://www.googleapis.com/auth/gmail.readonly

In the Google Admin interface, they should be specified on one line, separated by a comma.

Each API will require a "delegation" user -- a user on whose behalf the script is running.  For the "audit" API it will probably be your account but for the "gmail" API it will need to be the user against whose account the script runs.  If you have a user, foo@bar.com, and your script is getting a list of email subjects for that user, the delegation user will be "foo@bar.com".

Prerequisites - Python Modules


My API VM is a "fresh" FreeBSD 11.1 installation but it can be any system capable of running python3 - it could be FreeBSD, macOS, any modern Linux or any modern Windows.  As I've noted in other posts, I just happen to like FreeBSD.  I've added a user named 'demo' and they're able to issue commands via 'sudo'.

With that setup, I need to install python, pip and a few python modules. First, python and pip can be installed with

sudo pkg install py36-pip

If you have a Linux background, this is the equivalent of "sudo apt install python3-pip" on Debian/Ubuntu or "sudo yum install python-pip" on RH and derivatives.


Notice that on Linux systems, this usually provides "python3".  That is typically a link to a specific 3.x version of python.  FreeBSD doesn't provide the link by default so if you're installing on FreeBSD, keep that in mind. This is why it's "py36-pip" instead of something like "py3-pip".  For example, on a system running Ubuntu 16.04.3 LTS, "/usr/bin/python3" is a link to "/usr/bin/python3.5".

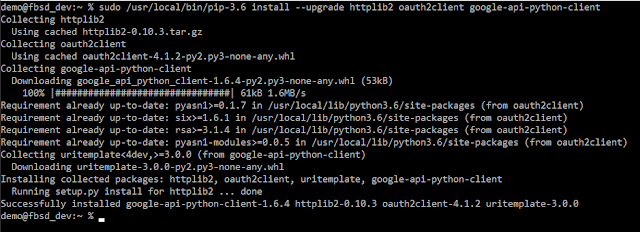
Once python and pip are installed, it's time to install the necessary python modules.  These are:


  • httplib2
  • oauth2client
  • google-api-python-client


This is why I wanted pip - some package managers will actually have separate packages for each of these but using pip lets me stay current.  Again, notice I'm calling it with "pip-3.6" instead of the "pip3" you'd see on a Linux system.


Start python from the command line with either "python3" or "python3.6" and you can interact with it directly.  You can use the following as a simple "test" script to make sure your modules are installed and will work:

import httplib2
from apiclient import discovery
from oauth2client.service_account import ServiceAccountCredentials
quit()

When I did it, it looked like this:


Start Scripting


Now that python/pip/necessary modules are installed and I have my oauth2 token and delegated account name, it's time to write a small script that reads in those credentials and attempts to connect to Google.  This first script is going to use the "Admin SDK" and you can read up on it here:  https://developers.google.com/admin-sdk.

There is a LOT of information there so to be a little more specific, we're going to use the "reports" API.  You can read more about that here:  https://developers.google.com/admin-sdk/reports/v1/get-start/getting-started

If you want to dive straight into some of their more technical documentation, I do find the API reference for the Admin SDK to be quite good in some ways and it can be found here: https://developers.google.com/admin-sdk/reports/v1/reference

With that bit of "light reading" provided, let's start on a "first script".  This will:


  • import the required modules
  • attempt to read the oauth2 token file (remember, mine is "client_secret.json")
  • attempt to set the necessary scopes (I listed them above)
  • attempt to create delegated access (this means the script will act on behalf of an actual account)
  • attempt to build an "admin"/"reports_v1" API object
  • attempt to authorise that object with Google


In code, this would look like:

import httplib2
from apiclient import discovery
from oauth2client.service_account import ServiceAccountCredentials
oauth2_file = "client_secret.json"
oauth2_acct = "my-account@my-company.com"
oauth2_scopes = ['https://www.googleapis.com/auth/admin.reports.audit.readonly',
                             'https://www.googleapis.com/auth/admin.reports.usage.readonly']
sa_creds = ServiceAccountCredentials.from_json_keyfile_name(oauth2_file, oauth2_scopes)
delegated = sa_creds.create_delegated(oauth2_acct)
http_auth = delegated.authorize(httplib2.Http())
service = discovery.build('admin', 'reports_v1', http=http_auth)
exit()

If I save it as "test_script.py", run it with "python3.6 test_script.py" and get no output, I know it works (and indeed it does for me).


The next thing I'm going to do is move the oauth2_ variables to another file called "api_info.py".  Instead of using, for example, "oauth2_file", I would have "import api_info" and then use that value with "api_info.oauth2_file".  In the long run it's going to save time and effort because I'm going to have several scripts all using the same credential information and if I change the scope, change the account, etc., I only have to change it in one place.  With that change, my "test_script.py" now looks like:


Authentication Logs


Now that I have a starting point, I want to make my script do something useful.  If you're going to start pulling logs from Google and put them into your SIEM (which should ultimately be the goal...), I would recommend starting with the login logs.  This gives you really good data like:


  • who logged in/out
  • at what time
  • from which IP address
  • success or failure


If you're correlating other authentication logs, this is a great addition for correlation.  Don't be afraid of volume here - in my day job we have approximately 20,000 users and the Google login logs are typically just a few megabytes per day.  I know of organisations with tens of thousands of users and they have 50GB/day Splunk licenses, they make sure they get their Google authentication logs.

When you query the "reports_v1" API, Google provides a list of "activities".  Each activity is a JSON object.  Those fields are documented here:  https://developers.google.com/admin-sdk/reports/v1/reference/activities/list

This is a sample failed login for one of my domains:


At 17.03 UTC on 28th of December, someone at the IP address 1.2.3.4 tried to login to Google using "a.user@my-domain.com" as the username and it failed due to an invalid password.  Yes, I edited the *content* of the fields for demonstration purposes but each successful and unsuccessful login will have each of those fields with the appropriate values. That object will come all on one line, though, so it can be a bit difficult to read.

Getting the Authentication Logs


Now it's time to work on the script so it retrieves and displays authentication logs in a meaningful way!

From the API documentation, I know that I need to call activities().list().execute(), and I know I need to give it two parameters:


  • applicationName - this will be 'login'
  • userKey - this is a specific FULL email address in your domain OR you can use the keyword 'all'


From the above screenshot, I also know that I'm going to get a bunch of JSON objects that have ['id']['time'], ['actor']['email'] and ['ipAddress'] fields, so I know I can look specifically for those.  I also know ['events'][0]['name'] is going to tell me where it was a login_success, login_failure or logout, so I want that as well.

Adding that information to my script, I know have:

import api_info
import httplib2
from apiclient import discovery
from oauth2client.service_account import ServiceAccountCredentials
sa_creds = ServiceAccountCredentials.from_json_keyfile_name(api_info.oauth2_file, api_info.oauth2_scope)
delegated = sa_creds.create_delegated(api_info.oauth2_email)
http_auth = delegated.authorize(httplib2.Http())
service = discovery.build('admin', 'reports_v1', http=http_auth)
results = service.activities().list(userKey='all', applicationName='login').execute()
activities = results.get('items', [])
for activity in activities:
  print()
  print("New login record")
  print("Time: " + activity['id']['time'])
  print("Email Address: " + activity['actor']['email'])
  print("IP Address: " + activity['ipAddress'])
  print("Event result: " + activity['events'][0]['name'])
exit()

Since I'm doing something specific, I'm going to go ahead and save this version as "get_logins.py".

When it runs, I'll get a list of the first 1000 login successes and failures for all users in my domain for UP TO the last 180 days.  The 1000 limit is easy to address but it's beyond the scope of this post; I'll provide a github link at the end that has a version of this script with it included. For example, this is an (edited) sample of what I get for an account I've only used from one location:


If I wanted to search for JUST logs for "test.acct@my-domain.com", I'd use that as the userKey value instead of 'all' and my results would be identical.

IR-driven Scripting


Since most of my work is incident response driven, let's have a wee scenario.  An attacker phishes a set of credentials and logs into someone's email.  At that point they decide to launch a spear-phishing campaign against select members of your management but they want any responses to be invisible to the person actually uses the account - maybe they add a filter that automatically sends those emails to the Bin.  It's 2 AM and the SOC analyst on-call, Lexi, gets a support ticket from the CFO saying, "this is Janet, the CFO. I just received an odd email from Steve in HR saying he has an emergency purchase that needs approval tomorrow but the file he sent me won't open! the subject is 'emergency purchase'." The analyst takes a closer look and sees it was actually submitted at 9PM the night before but they're just now receiving it.

Okay, let's walk through this.  It's 2.00 AM so calling Janet is a Really Bad Idea.  You don't call C-levels in the middle of the night unless they've JUST contacted you.  Angry spouses, upset babies, waking up a C-level, these are all resume-generating events.  Your analyst probably isn't a Google "superadmin" so they can't check the actual email log to get information about the emails sent from Steve to Janet.  For the sake of argument let's say you aren't using Vault or some other archival tool because <pick a reason>.  What does Lexi do?

As it turns out, there are a host of tools available to her via the "gmail" API.  Google's documentation for it is here:

https://developers.google.com/gmail/api/guides/

and the API reference is available here:

https://developers.google.com/gmail/api/v1/reference/

One simple thing to do would be to search Janet's email for any messages from Steve with a subject of "emergency purchase".  From the above reference, I know the API lets me retrieve a list of message IDs that match a query filter and that I can then use that message ID field to retrieve actual emails; additionally, I know that I can use ['payload']['headers'] to get the message headers (like "From", "To", "Subject", etc) and I know there is a ['snippet'] field that has a short, plain-text version  of the email. With that knowledge, I can write something like the following:

import api_info
import httplib2
from apiclient import discovery
from oauth2client.service_account import ServiceAccountCredentials
query = 'subject: "emergency purchase'
userID = 'cfo.janet@my-company.com'
sa_creds = ServiceAccountCredentials.from_json_keyfile_name(api_info.oauth2_file, api_info.oauth2_scope)
delegated = sa_creds.create_delegated(userID)
http_auth = delegated.authorize(httplib2.Http())
service = discovery.build('gmail', 'v1', http=http_auth)
query = 'subject: "emergency purchase'
userID = 'cfo.janet@my-company.com'
results = service.users().messages().list(userId=userID, q=query).execute()
messages = results.get('messages', [])
for aMessage in messages:
  mid = aMessage['id']
  msgObject = service.users().messages().get(userId=userID,id=mid).execute()
  for aHeader in msgObject['payload']['headers']:
    if aHeader['name'] == "To":
      print("Recipient is: " + aHeader['value'])
    elif aHeader['name'] == "From":
      print("Sender is: " + aHeader['value'])
    elif aHeader['name'] == "Subject":
      print("Subject is: " + aHeader['value'])
    elif aHeader['name'] == "Message-ID":
      print("Message ID is: " + aHeader['value'])
    print("Snippet from email: ")
    snippet = msgObject['snippet']
    print(snippet)
    print()
exit()


NOTE: the gmail.readonly, gmail.modify or https://mail.google.com/ scopes must be allowed for this to work.  I HIGHLY recommend using the gmail.readonly scope unless you want your SecOps team to have the ability to delete emails (which you may do once they're adept at finding the message IDs of phishing messages).

If Lexi had such a script, named 'get_headers.py', and were to run it, she may get something like this:


Using the same API, she could go further and retrieve the actual attachment.

What if the email HAD come from Steve's proper account, though?  At this point Lexi could use get_logins.py to see which IPs had accessed Steve's account and then look for additional accounts being accessed from the same address.  She could then possibly find other malicious/phishing emails that were sent and, if allowed the .modify scope, delete them from user mailboxes before the user ever sees them.

Wrapping Up


The Google/G Suite API offers a fantastic opportunity for incident responders and SecOps teams to have visibility into their email and collaboration environment.  It not only allows us to pull information in an easily-parsed format (json) for one-off searches but also to pull logs in volume to import into our (hopefully) much faster and more powerful SIEMs.  With a little bit of tuning, any of the scripts I've offered above can write log data in CSV, JSON or XML, with field and header names of your choosing, and they can be executed via any scheduling mechanism your operating system uses.  Since this is part of a series about being a SIEM, a post in the very near future will rely on some of these scripts writing out in JSON so if you do take a look at them on github, know they are very much early versions!

As promised, they're at:

https://github.com/kevinwilcox/python-google-api

Take a look at all the other tools that are available, by all means.  GAM is the de facto for managing Google domains from the CLI and should be part of everyone's toolkit...but if you're going to embed GAM into a script to do something, why not use the API directly to accomplish *exactly* what you want?

A New Year, A New Lab -- libvirt and kvm

For years I have done the bulk of my personal projects with either virtualbox or VMWare Professional (all of the SANS courses use VMWare). R...