23 April 2017

Beginning ELK Part Three: Getting Started With elasticsearch

Before I jump into talking about elasticsearch, I want to make a few quick comments on what this post is and isn't.

This post is a brief overview of some elasticsearch concepts and some very basic configuration settings/interactions. It is not a deployment guide or user's reference.

If you're Unix- or Linux-adept, you've probably used curl or wget. If not, that's okay! All you need to know about them is that they are used on the command-line on Unix-like systems to make requests of web servers. I will use curl in a couple of examples but almost anything that interacts with a web server will work - curl, wget, powershell libraries, python libraries, perl libraries, even a graphical web browser (like Chrome or Edge) to some degree. The key thing is that you don't need to be familiar with curl yet so don't feel overwhelmed when you see it.

A Too-Wordy Overview


If you really want to make things, well, boring, you can describe elasticsearch and hit pretty well all of the current buzz words: cross-platform, Lucene-based, schema-free, web-scale storage engine with native replication and full-text search capabilities.

I don't like buzz word descriptions, either.

In a little less manager-y phrasing, it's for storing stuff. You can run it on several systems as a cluster. It does cool things like breaking stuff into parts and storing those parts on multiple systems, so you can get pretty speedy searches and it's okay to take systems down for maintenance without having to worry about stopping the applications that rely on it. You can send stuff to and retrieve from it using tools like wget and curl. If you need it to grow then you can do that, too, by adding servers to the cluster, and it will automatically balance what it has stored across the new server(s).

It can work in almost any environment. It's written in Java and you can run it on Linux, BSD, macOS and Windows Server. I use Ubuntu for all of my elasticsearch systems but I'm testing it on Windows Server 2012 (sorry, I'm doing that at work, so no blog posts on it unless Microsoft donates a license for me to use or I decide to pay for some Windows Server VMs). Want to use Amazon's S3 to store a backup of your data? Yep, it does that, too. You can specify an S3 bucket natively to store a backup or to restore with no additional tools.

Okay, I think that's probably enough on that.

Data Breakdown


There is a LOT of terminology that goes around elasticsearch. For now, here's what you need to know:

document - this is a single object in elasticsearch, similar to a row in a spreadsheet
shard - a group of related documents
index - a group of related shards
node - a server running elasticsearch
cluster - a group of related nodes that share information

At this point elasticsearch users are probably screaming at me because I've left out a lot of nuance. Know these are generalisations for beginners. If you stick with this blog I'll get more precise over time. In this context my single VM is both a node and a cluster - it's a cluster of one node. It will have an index that holds the sample log data I want to store. That index will be split into shards that can be moved between nodes for fault tolerance and faster searching. Those shards will contain documents and each document will be a single line of log data.

A Default Node


In Beginning ELK Part One, I installed elasticsearch on Ubuntu using Elastic's apt repository. I'm not using THAT VM for this post but I've installed the entire stack using that post for consistency.

The default installation on Ubuntu is usable from the start if you want to use it for testing or non-networked projects. If you have an application that speaks elasticsearch then you can pretty well install it, tell your application to connect via localhost and be in business. For right now I'm running it with the default configuration. I booted the VM, checked to make sure there were no elasticsearch processes running via "ps", started it with systemctl (I used restart out of habit, start would have been better) and used journalctl to see if it logged any errors on startup:


Next I used curl to query the running instance and get its "health" status. ES uses a traffic light protocol for status so it's either red, yellow or green. Without getting too far into what each means, for starters just know red is bad, yellow is degraded and green is good. The general format of a curl request is "curl <optional request type> <URL>". In the URL you'll see "?pretty" -- this tells elasticsearch to use an output that *I* find easier to read. You're welcome to try it with and without that option to see which you prefer!


Notice the value of "cluster_name". By default, ES starts with a cluster name of "elasticsearch". This is one of the things I'll change later. If you only have one cluster then it's not a big deal but if you have multiple clusters I highly recommend changing that. I recommend changing it anyway because if you have one cluster you're probably going to eventually have more!

"number_of_nodes" indicates how many systems running ES are currently in the cluster. That's a slight abuse of the terminology since you can run multiple nodes on a large system but most people will run one ES instance on each server.

"number_of_data_nodes" indicates how many of the ES nodes are used for storing data. ES has multiple node types - some store data, some maintain the administrative tasks of the cluster and some allow you to search across multiple cluster. This indicates how many nodes that store data are available in the cluster.

Once you're a little more familiar with elasticsearch, or if you want to know specific information about each node, another useful query is for the cluster "stats". It has a LOT of output, even for a quiet one-node cluster, so I'm only showing the first page that is returned (since it's chopped off, I just replaced "health" with "stats"):


Some Slight Changes


Especially for the loads I'm going to put on my single-node cluster, there are VERY FEW changes to make to the ES configuration file. One of the themes running through most of the community questions I've seen asked is that people try to toggle too many settings without understanding what they will do "at scale".

For this cluster, I'm only going to make two settings changes - I'm going to name my cluster and name my node. In my next post I'll add another node to the cluster and make a few more changes but this is sufficient for now. These changes are made in

/etc/elasticsearch/elasticsearch.yml

The elasticsearch directory is not world-readable so tab-complete may not work.

When I edit config files I like to put my changes at the end. If this were a file managed by, e.g., puppet, it wouldn't matter because I'd push my own file but for these one-offs I think it's easiest to read (and update later...) when my changes are grouped at the end. To make things simple and readable, I'm going to name this cluster "demo-cluster" and this node "demo-node-0". By default it will be both a master node, meaning it controls/monitors cluster state, and a data node, so it will store data.

cluster.name: demo-cluster
demo.name: demo-node-0

In the actual config file, this looks like:


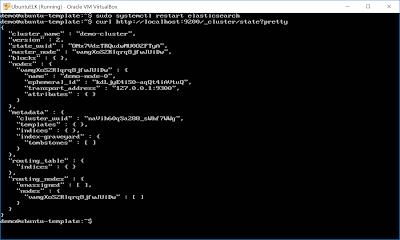
Now when I restart elasticsearch and ask for cluster information, I get much more useful output:


If you take a close look, you'll see the cluster_name has been set to "demo-cluster" and, under "nodes", the name for my one node is set to "demo-node-0".

My First Index and Document


Right now my ES node doesn't have an index (at least, not that isn't for node/cluster control) yet. You can create an index on the fly with no structure by writing something. For example, if I want to create an index called "demo_index" and insert a document with a field called "message_text" with a value of "a bit of text", I can do that by using curl to POST a JSON object as data to elasticsearch and I can do it all at one time. If you know what you want your index to look like ahead of time, instead of being "free form", you can create it ahead of time with specific requirements. That is a better practice than what I'm doing here.

In the below example, "-XPOST" means to do an HTTP post, "9200" is the port elasticsearch runs on by default and the stuff after "-d" is the data I want to write. Note it must be a valid JSON object and I've surrounded it with single quotes, that I'm using "demo_index/free_text", meaning this document has a type of "free_text", and I'm specifying "?pretty" so that the results are formatted for reading:

curl -XPOST http://localhost:9200/demo_index/free_text?pretty -d '{"message_text":"a bit of text"}'

When I run it on my node, I get the following:


First of all, yes, the output is kind of ugly - that's because elasticsearch returns a JSON object. If you inspect it, the important items are:

_index: demo_index
result: created

This means the demo_index was successfully created!

A Simple Search


To query elasticsearch and see what it thinks the "demo_index" should look like, I just need to change the curl command a wee bit (note I removed the "-X" argument - the default curl action is a GET so specifying -XGET is extraneous, and I've added the ?pretty option so it's easier to read):

curl http://localhost:9200/demo_index?pretty

Elasticsearch returns the following:


The first segment describes "demo_index". There is one mapping associated with the index and it has a property called "message_text" that is of type "text". Mappings allow you to change the type of those properties so, for example, you can specify a property should always be an integer or text.

The second segment lets me know that "demo_index" is an index, that it has five associated shards (so the data is broken into five segments), that each shard is stored twice (number_of_replicas), the Unix-style timestamp of when it was created and that its name is "demo_index". The number of shards and number of replicas per index can be changed on the fly or in an "index template" but that's a bit more advanced than we need to go right now!

If I want to query elasticsearch for my data, I can have it search for everything (if you're used to SQL databases, it's like doing a "select * from demo_index"):

curl http://localhost:9200/demo_index/_search?pretty

This returns the entire index:


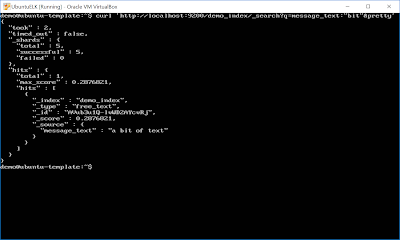
I may not want to have ES dump EVERYTHING, though. If I know I have a property called "message_text" and I want to search for the word "bit" - that search builds on the previous command by specifying a query value (noted as "q"):

curl 'http://localhost:9200/demo_index/_search?q=message_text:"bit"&pretty'

This time I put the URI inside of single quotes. If I didn't, when it got to the &, bad things would happen and the command would be misinterpreted. If you want to know more, you can Google for "bash shell ampersand" and "escaping special characters in bash". For now, just know I've put it in single quotes so that it treats everything from http to pretty as an option to curl.

When this runs, I get:


This lets me know it was able to successfully query all five shards and that one document matched the word "bit". It then returned that document.

Now Delete It


You can delete individual documents using the _delete_by_query API (or if you have the ID of the document) but that's for another post because it goes into some JSON handling that is beyond simple interaction. For now, since I'm dealing with a test index, I just want to delete the entire index. I can do that with:

curl -XDELETE http://localhost:9200/demo_index?pretty

I'm going to let that sink in for a second. No authentication, no authorisation, no special knowledge, all you need is access to a node to get the name of an index and then delete it. This is why the X-Pack subscription, and careful connection filtering, are so important!

When I run the above, I get the following:


It can take up to several minutes for the command to be replicated to all of the data nodes in a large cluster. As before, I can check the index status with curl:


For those who may be curious, yes, you can list all of the indexes in your cluster:


Wrapping Up


I know, I've covered a LOT in this post! There's some information on elasticsearch in general and how to create, query and delete indexes. There is curl, which may be new to some readers. It's a lot to take in and I've just scratched the surface of what you can do with elasticsearch using only curl. The Elastic documentation is fantastic and I highly recommend at least perusing it if you think ES may be useful in your environment:

https://www.elastic.co/guide/en/elasticsearch/reference/current/index.html

16 April 2017

Beginning ELK Part Two: Getting Started With Logstash

Every indicator I've seen has pointed to ELK becoming EK for most users - where logstash as a transport isn't really needed because so many things can write directly to elasticsearch. Now that elasticsearch has the idea of an "ingest node", basically a lightweight processor for logs, the argument for a full-fledged logstash node (or nodes) isn't as important for most users who want to read and search logs without much parsing or without adding a lot of metadata.

I still like having logstash around, though. To me it's cleaner to push data to logstash than to try to configure elasticsearch with multiple pipelines (ingest nodes), and there are still filters/plugins that aren't implemented in elasticsearch. If you have network equipment that can speak syslog, logstash can ingest those and push them into elasticsearch. If you want to parse them in specific ways, and add or change certain fields, then send them to multiple storage locations, you want logstash. One example of this that I want to work on is sending to elasticsearch for short-term retention and S3 for long-term archival (since S3 can then transition to Glacier after <x> days; note also that elasticsearch can use S3 as a snapshot repository!).

An Act in Three Scenes


ELK, as a whole, can be thought of as a play in three acts. In the first act you read/receive/store data (logstash). In the second act you index and analyse the data (elasticsearch). In the third act you visualise the data (kibana).

If that's the case, I like to think of logstash (and its configuration file) as an act in three scenes - because it is broken up into three sections, each performing an important part in receiving and storing data.

Logstash (at least on Ubuntu, when installed through apt via the elastic repository) comes without a configuration file. If you have installed via the method at Beginning ELK Part One, you had an empty configuration directory. I'm starting with a fresh installation via the same instructions and /etc/logstash/conf.d/ is an empty directory:


Scene One: Input


The first section in a logstash configuration is the "input" section. This is where you tell logstash how to receive your data. There are all manner of ways to read data. Some of the more familiar ways may be via the syslog protocol or from a local file, but there are some pretty exotic (at least to me!) ways to read data. For example, you can configure logstash to read from an S3 bucket, from CloudWatch, by an HTTP POST and from message queuing  systems like redis, zeromq, rabbitmq and kafka. The list of input plugins recognised by Elastic can be found here: 


Note not all of them are supported by Elastic!

The one I'm going to start with is "stdin". This is really useful for debugging because you can type out a log entry or paste a few lines from a log without having to configure logstash to read that log file. Since I do a lot over SSH, it's nice to be able to copy a few lines of a log from one box and test it with a logstash instance configured for stdin. If you aren't familiar with "standard in"/"stdin" and "standard out"/"stdout", that's okay! In general "standard in" means from the command line or keyboard and "standard out" means to the display.

Any file in /etc/logstash/conf.d/ will be read as a configuration file. To get started, I want to add a file called "intro.conf" and I'll add in "input" section with a type of "stdin":


Scene Two: Filter


I use ELK with Bro *a lot*. By default, the "originating IP" for a connection is knows as id.orig_ip. That's great, except the "." is kind of special in elasticsearch and it doesn't like having fields with a dot in their name -- so I use logstash to change that, on the fly, to an underscore. I do this in the "filter" section.

For now let's have our "filter" section be empty. We can come back to it in just a bit, once we've seen how all of the parts of the logstash configuration file work together.


Scene Three: Output


The "output" section is where you tell logstash where you want it to send your data. This is where you'd tell logstash how to connect to your elasticsearch nodes, your S3 bucket, maybe to syslog to send to a massive syslog cluster for long-term archival or maybe to Splunk if something in the data matched a specific criteria. For our needs, though, I want to keep things as simple as possible. Since we're reading data in from standard in/stdin, let's push it to standard out/stdout (remember, stdout is generally the display).

There is ONE option I want to set in the output section, other than to send the output to stdout. Logstash has a wonderful debug codec you can use that shows you exactly how logstash parses your data. It's called the rubydebug codec and it makes learning how logstash does stuff a lot easier (or it did for me!).


Why am I using screenshots instead of pasting the actual config lines here? Because most people learn better by doing than by reading :)

With that saved, I can start up logstash from the command line and test my configuration.

First Test - Hello, World!


Even though logstash won't be started (this time) as a service, it still requires permission to write to certain areas that my demo user can't write - so it has to be started with sudo.

On Ubuntu, installed from the Elastic repository with apt, the logstash binary lives at /usr/share/logstash/bin/logstash. It has to know where the configuration is with "--path.settings" and, to make things easy, I'll just have it use the rest of the settings found in the /etc/logstash directory.

That means the entire command looks something like this:

sudo /usr/share/logstash/bin/logstash --path.settings /etc/logstash

Once it's started, you should get a prompt asking for data (it can take a minute for everything to start, don't worry if you don't get any output immediately):


At this point, anything you type will be parsed as input and SHOULD be returned back to you in the way logstash knows how to parse it. For example, if you type "Hello, World!", you should get something back like this:


The Output


Okay, let's talk about the output for just a second. Instead of breaking the data provided into "Hello" and "World!", logstash treats that as a single message (as it should, it was the message you gave to logstash!). However, it also added a couple of pieces of metadata around the message, such as the timestamp on the system when logstash received the message.

This timestamp business (technical phrase, I promise) is important because if you receive a log entry with a timestamp in it, logstash will *by default* add a metadata field called "timestamp" but it will be the timestamp *when it was received by logstash*, not the timestamp in the message. Try it with the running logstash instance and see!


Don't worry, you can add your own field for the timestamp when the data was received via a filter (but we're not going to do that in this post - just know you can).

To stop logstash, hit Ctrl+C.

JSON Input


In my last couple of posts I had written some scripts to generate some sample log data and the output is in JSON. If you're not familiar with JSON, that's okay, I only having a passing familiarity with it myself. The short version is that it pretty much looks like a CSV only it has key/value pairs so you aren't left wondering what everything is and a single JSON object is surrounded by curly braces.

I like JSON because I think it's readable (it's also fairly portable!), but there's a big win with JSON if you're using ELK. You can tell logstash to parse your data as JSON adding a codec option to the stdin input type, like so:


Now I can feed logstash data formatted as a JSON object and it will do something interesting. For example, For example, I'm writing this on 16 April 2017 - the 271st anniversary of the Battle of Culloden. I can give it the following input:

{"ts":"1746-04-16T11:00:00.0000+00:00","event.type":"battle","event.location":"Culloden"}

Since that's a valid object in JSON, logstash parses it like so:


Notice logstash separates the data into its key/value pairs! Instead of writing a parser, or a big grok statement, to read "1746-04-16T11:00:00.0000+00:00 battle Culloden", I can save a lot of work by giving logstash JSON directly. I work a lot with Bro logs so I configure Bro to output in JSON and updating OSSEC so I can take advantage of its JSON output is high on my list.

For that matter, you can even write system logs in JSON via native log software in Linux! A HOW-TO for syslog-ng can be found here:


and a HOW-TO for rsyslog can be found here:


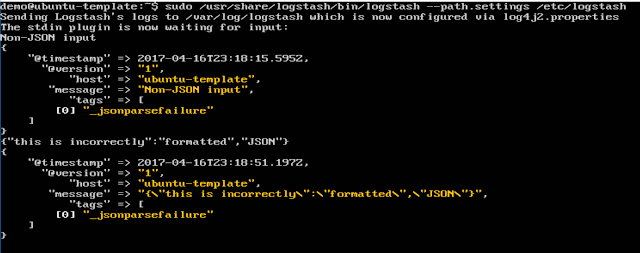
What about if you give it non-JSON input or invalid JSON? Logstash will throw an error, identifed by "_jsonparsefailure":


Back to Filter


Let's go back to the filter section for a really common use of filters - renaming fields in log data. Above, I have fields named "event.type" and "event.location". Elasticsearch wouldn't like that very much and I'm not entirely certain I like having the "." in there. What if I wanted to rename the fields to "event_type" and "event_location" but I don't have access to the application that creates the logs? Logstash can do that on the fly! In all fairness, so can elasticsearch, but that's another post...

Logstash does this with the "mutate" filter. The actual option is, helpfully enough, named "rename", and it's used to rename fields. The format for rename is:

rename => { "old_name" => "new_name" }

Mutate also lets you do things like add and remove fields or adding/removing tags that can be used for additional filtering or custom output locations later on. The full documentation for "mutate" can be found here:


Since I want to rename two fields, I need two rename statements. I've also taken a little time to make the input/output sections read a bit more like the filter section -- it's okay, that's just formatting in the configuration file and doesn't affect the performance at all. After my changes, the new configuration looks like this:


Now, if I feed logstash the same data as above, I get this:


Wrapping Up


Logstash is a powerful log-o-matic tool for slicing, dicing and enriching logs before pushing them to some storage engine. It supports reading data from and writing data to a wide variety of locations. Sure, some of the functionality is built in to elasticsearch now - for example, you can rename fields with elasticsearch before it stores/analyses the data - but I still like it and think it has its place (for example, if you're consuming logs from sources that only speak syslog).

11 April 2017

Generating Sample Log Files Part Two: Do It In Python


I didn't really like the run time of my bash script, and I really want to dig some more into python (meaning expect me to do it wrong *a lot*), so I re-wrote it in python.

I also changed a few things...

Some Additions


The script I started with only writes something that looks like a proxy log - but sometimes you want more than just one type of log. For the python version, I've added a "dns" type that make something that looks a bit like passive DNS logs and I've added a stub for DHCP-style logs.

I've also added an option to let me decide, at invocation, how many days I want logs for. There is no error checking - creating logs for 3000 days may fill your hard drive with log files. Don't do that. Use small numbers like 1 and 2 until you see how much disk they use.

The one big thing I want to work on is the "consistent" option. Ideally I'd like to have a DHCP entry for <foo> MAC address that creates <foo_two> DNS log by visiting a given site that generates <foo_three> proxy log. Right now everything is pseudo-random - that's great for analysing individual log types but rubbish for creating a large volume of cohesive logs of multiple types.

As with everything, it's a work in progress...

Change in I/O


The existing script just redirected output to a file -- if it existed then it deleted it and started a new one, so you were always guaranteed "fresh" data. While I have a need for a file that changes every few seconds, I also want to be able to create a big log file in a short amount of time. To that end, I've changed how the python script writes.

Instead of opening the file, appending one line and then closing it, the python script is a bit more efficient. It batches the writes in groups of 10,000 - so it opens the file once, collects ten thousand lines of log in RAM, writes out those ten thousand, clears the variable, collects another ten thousand, etc., then closes the log when it finishes.

Did It Help?


The bash script took approximately three hours to run. That's not an inconsequential amount of time to have to wait just to have a month's worth of log file to pump into Splunk, ELK, GrayLog2 or whatever.

The python script, by comparison, can write 30 days of logs in 45 seconds (actual time measured using "time ./createLogs.py --days 30 --proxy" is 42.9 seconds!). That's a HUGE difference in wait-time! I had time to cook *and eat* supper while the first script ran. I can't put the kettle on and be back before the python script finishes!

Show Me The Code!


Like I said, I am a complete newbie in python. I've hacked a few scripts together to do some basic things I've needed and this certainly falls in the category of "hacked together"! This is my first foray into time and arrays in python so some things are done in weird ways to help me grok how things work. All of that said, you're more than welcome to it. You can find it here:

https://github.com/kevinwilcox/samplelogs

Notice that has a link to both scripts, in bash and python, and while they'll both *run* at the time of code commit, I make no promises that they'll do anything they're supposed to do. User beware, I'm not responsible if they bork something on your system, they're freely offered without support under the BSD 3-clause licence, etc.

04 April 2017

Generating Sample Log Files

As I work on ELK posts (and even on a couple of upcoming Splunk posts), I've realised I have a significant problem: I don't really have a good set of log data that I can use as an example for doing interesting things with ELK. This left me with a couple of options. Either I could install some server software and generate a lot of requests over several weeks or I could script something that created a month or two of logs in a few minutes.

Well that is a pretty easy decision!

I'm not going to go through the script I wrote to generate the sample data. Instead, I'm going to talk a little bit about the script and its output and then provide a link to the script at the end.

Make Life Easy, Use JSON


This could start a text-format Holy War but I'm going to make an executive decision, from the start, to use JSON. It may not be as compact as something like BSD syslog or CSV but I think it is easily readable, it's still easy to parse with cut/awk and you don't need to run it through a grok pattern in logstash to push it to ELK - you can just dump it directly into elasticsearch! I'm going to use JSON.

My Key/Value Pairs


I wanted to have a log that would be *similar* to something you may find, that could let me do one or two interesting things in ELK (and later in Splunk) and that would be simple to read. I opted for a log that may be similar to a web proxy log. Therefore, I decided on the following fields (keys):

1. timestamp - this is in ISO-8601 format (and in UTC)

2. ip_address - this is the IP address of the system making the request; I have six possible IP addresses:
  • 10.10.10.1
  • 10.10.10.3
  • 10.10.10.8
  • 10.10.20.2
  • 10.10.20.5
  • 10.10.20.13
3. username - this is the user authenticated with the proxy; I have seven users:
  • alvin
  • simon
  • theodore
  • piper
  • prue
  • pheobe
  • paige

4. site - this is the URL being requested; I have four sites:
  • https://www.bbc.co.uk
  • https://www.bbc.com
  • https://www.google.com
  • https://www.cnn.com

To make things interesting, any user may have any IP at any time. That means piper may request https://www.bbc.co.uk from IP 10.10.20.13 and one second later simon may request https://www.cnn.com using the same IP.

A Note on BASH


Bash isn't my favourite shell and it isn't my favourite scripting language but it truly is Good Enough for a lot of things, including this. To really get an idea of what you can do with it, I recommend perusing the "Bash Guide for Beginners" at The Linux Documentation Project:


The Overview


The script itself does the following:

o establish arrays for users, sites and IPs
o get the current time
o get the time from one month ago (this is arbitrary)
o write one log entry for each second between those two times (appends to a log file via stdout redirection)

A Sample Entry


What does this look like in the actual log? Here's a sample entry:

{"timestamp":"2017-03-28T01:37:54+00:00","ip_address":"10.10.10.1","username":"paige","site":"https://www.bbc.co.uk"}

Again, I chose this format because the key/value pairs mean you can look at a single entry and never have to guess what any field is. One of the best things I did for my Bro logs, where I may need to give exports to people who don't read Bro every day, is start outputting in JSON format!

Wrapping Up


To generate (in my VM) the two million-ish log entries I want to use took about two and a half hours.

There are certainly more efficient mechanisms BUT I also want to do some things in the future with reading log files that change (for example, having logstash or filebeat read from an active log file), so this fits both needs at the loss of speed, elegance and correctness (there are certainly better ways to write to a file in bash than using output redirection after every line!!).

Sometimes you just don't want to run through all of the setup necessary to generate a lot of log data. Sometimes you DO want to but don't have the hardware available (and don't want to spin up a bunch of systems at AWS or Azure). When that happens I think it can be perfectly fine to script something that generates sample log data, just know it can take some work to get there!

The script I used can be found here:

https://raw.githubusercontent.com/kevinwilcox/samplelogs/master/createProxyLogs.sh

A New Year, A New Lab -- libvirt and kvm

For years I have done the bulk of my personal projects with either virtualbox or VMWare Professional (all of the SANS courses use VMWare). R...