I still like having logstash around, though. To me it's cleaner to push data to logstash than to try to configure elasticsearch with multiple pipelines (ingest nodes), and there are still filters/plugins that aren't implemented in elasticsearch. If you have network equipment that can speak syslog, logstash can ingest those and push them into elasticsearch. If you want to parse them in specific ways, and add or change certain fields, then send them to multiple storage locations, you want logstash. One example of this that I want to work on is sending to elasticsearch for short-term retention and S3 for long-term archival (since S3 can then transition to Glacier after <x> days; note also that elasticsearch can use S3 as a snapshot repository!).
An Act in Three Scenes
ELK, as a whole, can be thought of as a play in three acts. In the first act you read/receive/store data (logstash). In the second act you index and analyse the data (elasticsearch). In the third act you visualise the data (kibana).
If that's the case, I like to think of logstash (and its configuration file) as an act in three scenes - because it is broken up into three sections, each performing an important part in receiving and storing data.
Logstash (at least on Ubuntu, when installed through apt via the elastic repository) comes without a configuration file. If you have installed via the method at Beginning ELK Part One, you had an empty configuration directory. I'm starting with a fresh installation via the same instructions and /etc/logstash/conf.d/ is an empty directory:

Scene One: Input
The first section in a logstash configuration is the "input" section. This is where you tell logstash how to receive your data. There are all manner of ways to read data. Some of the more familiar ways may be via the syslog protocol or from a local file, but there are some pretty exotic (at least to me!) ways to read data. For example, you can configure logstash to read from an S3 bucket, from CloudWatch, by an HTTP POST and from message queuing systems like redis, zeromq, rabbitmq and kafka. The list of input plugins recognised by Elastic can be found here:
Note not all of them are supported by Elastic!
The one I'm going to start with is "stdin". This is really useful for debugging because you can type out a log entry or paste a few lines from a log without having to configure logstash to read that log file. Since I do a lot over SSH, it's nice to be able to copy a few lines of a log from one box and test it with a logstash instance configured for stdin. If you aren't familiar with "standard in"/"stdin" and "standard out"/"stdout", that's okay! In general "standard in" means from the command line or keyboard and "standard out" means to the display.
Any file in /etc/logstash/conf.d/ will be read as a configuration file. To get started, I want to add a file called "intro.conf" and I'll add in "input" section with a type of "stdin":

Scene Two: Filter
I use ELK with Bro *a lot*. By default, the "originating IP" for a connection is knows as id.orig_ip. That's great, except the "." is kind of special in elasticsearch and it doesn't like having fields with a dot in their name -- so I use logstash to change that, on the fly, to an underscore. I do this in the "filter" section.
For now let's have our "filter" section be empty. We can come back to it in just a bit, once we've seen how all of the parts of the logstash configuration file work together.
Scene Three: Output
The "output" section is where you tell logstash where you want it to send your data. This is where you'd tell logstash how to connect to your elasticsearch nodes, your S3 bucket, maybe to syslog to send to a massive syslog cluster for long-term archival or maybe to Splunk if something in the data matched a specific criteria. For our needs, though, I want to keep things as simple as possible. Since we're reading data in from standard in/stdin, let's push it to standard out/stdout (remember, stdout is generally the display).
There is ONE option I want to set in the output section, other than to send the output to stdout. Logstash has a wonderful debug codec you can use that shows you exactly how logstash parses your data. It's called the rubydebug codec and it makes learning how logstash does stuff a lot easier (or it did for me!).

Why am I using screenshots instead of pasting the actual config lines here? Because most people learn better by doing than by reading :)
With that saved, I can start up logstash from the command line and test my configuration.
First Test - Hello, World!
Even though logstash won't be started (this time) as a service, it still requires permission to write to certain areas that my demo user can't write - so it has to be started with sudo.
On Ubuntu, installed from the Elastic repository with apt, the logstash binary lives at /usr/share/logstash/bin/logstash. It has to know where the configuration is with "--path.settings" and, to make things easy, I'll just have it use the rest of the settings found in the /etc/logstash directory.
That means the entire command looks something like this:
sudo /usr/share/logstash/bin/logstash --path.settings /etc/logstash
Once it's started, you should get a prompt asking for data (it can take a minute for everything to start, don't worry if you don't get any output immediately):

At this point, anything you type will be parsed as input and SHOULD be returned back to you in the way logstash knows how to parse it. For example, if you type "Hello, World!", you should get something back like this:

The Output
Okay, let's talk about the output for just a second. Instead of breaking the data provided into "Hello" and "World!", logstash treats that as a single message (as it should, it was the message you gave to logstash!). However, it also added a couple of pieces of metadata around the message, such as the timestamp on the system when logstash received the message.
This timestamp business (technical phrase, I promise) is important because if you receive a log entry with a timestamp in it, logstash will *by default* add a metadata field called "timestamp" but it will be the timestamp *when it was received by logstash*, not the timestamp in the message. Try it with the running logstash instance and see!

Don't worry, you can add your own field for the timestamp when the data was received via a filter (but we're not going to do that in this post - just know you can).
To stop logstash, hit Ctrl+C.
JSON Input
In my last couple of posts I had written some scripts to generate some sample log data and the output is in JSON. If you're not familiar with JSON, that's okay, I only having a passing familiarity with it myself. The short version is that it pretty much looks like a CSV only it has key/value pairs so you aren't left wondering what everything is and a single JSON object is surrounded by curly braces.
I like JSON because I think it's readable (it's also fairly portable!), but there's a big win with JSON if you're using ELK. You can tell logstash to parse your data as JSON adding a codec option to the stdin input type, like so:

Now I can feed logstash data formatted as a JSON object and it will do something interesting. For example, For example, I'm writing this on 16 April 2017 - the 271st anniversary of the Battle of Culloden. I can give it the following input:
{"ts":"1746-04-16T11:00:00.0000+00:00","event.type":"battle","event.location":"Culloden"}
Since that's a valid object in JSON, logstash parses it like so:

Notice logstash separates the data into its key/value pairs! Instead of writing a parser, or a big grok statement, to read "1746-04-16T11:00:00.0000+00:00 battle Culloden", I can save a lot of work by giving logstash JSON directly. I work a lot with Bro logs so I configure Bro to output in JSON and updating OSSEC so I can take advantage of its JSON output is high on my list.
For that matter, you can even write system logs in JSON via native log software in Linux! A HOW-TO for syslog-ng can be found here:
and a HOW-TO for rsyslog can be found here:
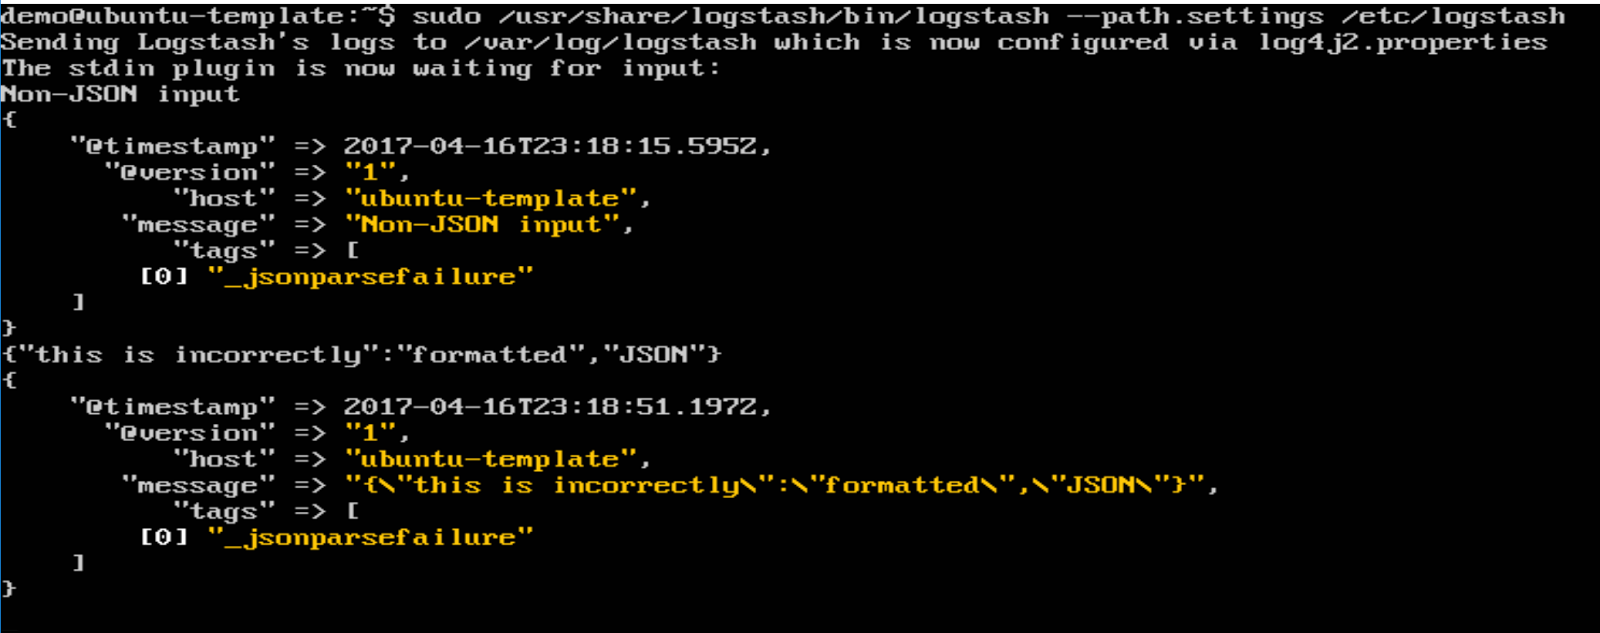
What about if you give it non-JSON input or invalid JSON? Logstash will throw an error, identifed by "_jsonparsefailure":
Back to Filter
Let's go back to the filter section for a really common use of filters - renaming fields in log data. Above, I have fields named "event.type" and "event.location". Elasticsearch wouldn't like that very much and I'm not entirely certain I like having the "." in there. What if I wanted to rename the fields to "event_type" and "event_location" but I don't have access to the application that creates the logs? Logstash can do that on the fly! In all fairness, so can elasticsearch, but that's another post...
Logstash does this with the "mutate" filter. The actual option is, helpfully enough, named "rename", and it's used to rename fields. The format for rename is:
rename => { "old_name" => "new_name" }
Mutate also lets you do things like add and remove fields or adding/removing tags that can be used for additional filtering or custom output locations later on. The full documentation for "mutate" can be found here:
Since I want to rename two fields, I need two rename statements. I've also taken a little time to make the input/output sections read a bit more like the filter section -- it's okay, that's just formatting in the configuration file and doesn't affect the performance at all. After my changes, the new configuration looks like this:

Now, if I feed logstash the same data as above, I get this:

Wrapping Up
Logstash is a powerful log-o-matic tool for slicing, dicing and enriching logs before pushing them to some storage engine. It supports reading data from and writing data to a wide variety of locations. Sure, some of the functionality is built in to elasticsearch now - for example, you can rename fields with elasticsearch before it stores/analyses the data - but I still like it and think it has its place (for example, if you're consuming logs from sources that only speak syslog).


No comments:
Post a Comment
Note: only a member of this blog may post a comment.