When I found out about the script from Justin Henderson (https://github.com/smapper), he warned me that it's best used on domains that aren't in the Alexa/Umbrella Top One Million. He's right, for the most part there isn't really a reason to do lookups on domains that are popular enough to be in the top one million sites on the Internet, but I'm not tagging those yet and sometimes I just really want more information about ad networks when they show up in my DNS logs. As a result, I started sending my 1k DNS queries per second to domain_stats and I *very quickly* saw a drop in throughput.
That left me with two questions:
- How many events were going through my pipeline each second before and after I started doing DNS enrichment?
- How long does each event, on average, spend in my pipeline, both before and after I started doing DNS enrichment?
X-Pack is fantastic for measuring events per second and I'll address its installation/configuration soon. The more interesting question right now is the latter and the solution was a lot easier than I thought it would be.
My Pipeline
Before I get into timing, I want to give an overview of my log pipeline. I have a cluster of logstash ingest nodes that receive events via a combination of inputs. These nodes send data to a RabbitMQ cluster that uses mirrored, persistent queues (highly available queues that store messages on disk). Another logstash cluster pulls events from RabbitMQ and then runs each event through a series of filters that parse fields, normalise names, add fields based on the workflows of my coworkers, enrich with additional information based on the fields already present in each log item and then send the enriched/processed data to the appropriate Elasticsearch index. That means from end to end, the log flow is:
[ endpoint beat ] --> [ logstash_ingest ] --> [ rabbitmq ] --> [ logstash_enrich ] --> [ elasticsearch ]
There are several ways to lay things out and it's perfectly acceptable to have endpoints use beats to write directly to Elasticsearch, if that's your preferred method. I've used Kafka as a message buffer and it works well - and the beats can write to it natively! Don't assume this is THE way to do it, figure out what works for you and what addresses the risks you face.
The Goal
The question I want to answer is how much time an event spends in my pipeline: I want to know when it enters the pipeline, when it comes out of RabbitMQ and when it is sent to Elasticsearch. To do this, I decided to:
- add a timestamp as the first (and only) filter when an event is received by an ingest node, called "pipeline_start"
- add a timestamp as the first filter on the enrich cluster when an event is retrieved from RabbitMQ, called "pipeline_rabbitmq_out"
- store the difference between "pipeline_rabbitmq_out" and "pipeline_start" as "pipeline_rabbitmq_processing"
- add a timestamp as the last filter on the enrich cluster, before the event goes to Elasticsearch, called "pipeline_stop"
- store the difference between "pipeline_start" and "pipeline_stop" as a field called "pipeline_processing_total"
It's pretty basic timing and it gives me an easy way to look *at any log event* and see if the overhead was on ingest/rabbitmq or if it was the enrichment cluster.
Making it Work
The easiest way I've found to add a timestamp to an event is with the ruby filter:
filter {
ruby {
code => "
event.set('s_time', Time.now)
sleep(1)
event.set('e_time', Time.now)
"
}
}
This adds a field, s_time, that is an ISO8601-formatted timestamp with the current time. It then sleeps/waits for one second and adds *another* field, e_time, that is also an ISO8601-formatted timestamp with the current time. Since there is a one-second pause between the two timestamps, there should be a one-second difference when I use this as my filter. Note I'm using stdin for input (so I can type something in) and stdout with the rubydebug codec as my output (so I can see the parsed version of what I type in).
My entire testing config looks like this:

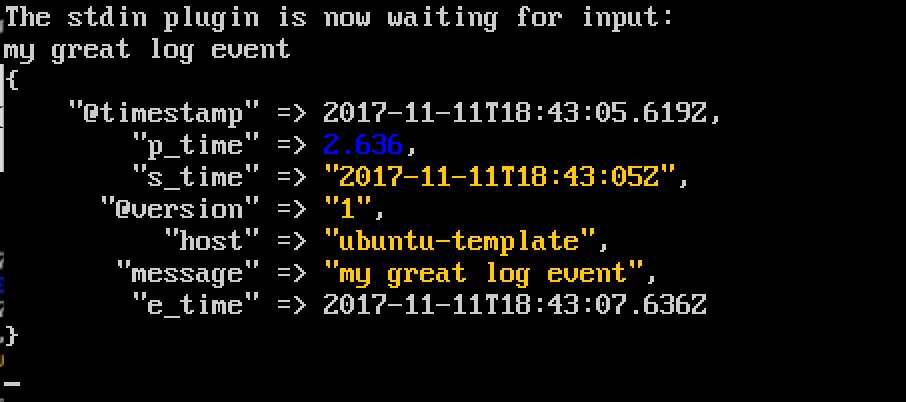
And when I run it with the test input of "my great log event", I get this:

Indeed, I have two timestamps, s_time and e_time, and they are one second apart!
Taking the Difference
Now let's go a step further. Having the timestamps is great but that leaves me looking at multiple fields and seeing the difference. Can't I just get the difference in ruby and store that as a third field?
Well...yes I can!
Ruby lets you subtract one timestamp from another and it handles all the type conversion on the backend. That means I can do something like "e_time - s_time" and Ruby will "just take care of it".
I'm going to update my filter to do the subtraction and store the third field, p_time (for processing time). Note I'm using "event.set('foo')" and "event.get('foo')" to set and retrieve the fields in my log event:

Now when I run with the same test input, I get:

p_time exists and it's being parsed as a number - you can tell because it's in blue and NOT in quotation marks. If I were sending this to a full ELK stack I could have a dashboard that showed the average p_time and, if I were tagging my logs, the tags associated with the events that took longest to process. Pretty useful information!
A Caveat: Time Objects Versus Strings
When I put this into production, I hit a bit of a snag. I was adding my start time in the first logstash cluster, sending the event through my buffer, then adding the second timestamp and finding the difference in the second cluster. event.get('s_time') would give me the ISO8601 timestamp but my processing times were coming back as the floating point representation of the ending timestamp. This means my start times were being stored but they were being treated as a zero during subtraction. I don't know why this happened, I don't know if it was something happening with logstash or RabbitMQ, but it was problematic!
After a bit of digging, I found out about the "Time.parse()" method in Ruby. This lets you create a Time object from a formatted string. To better represent how I've setup my filters, I'm going to separate setting the s_time and e_times into different filter blocks. In the first block I'm going to get the timestamp as a formatted string instead of as a Time object and store that as s_time. In the second block I'll use local variables to do the arithmetic and then store the e_time and p_time values using the "event.set('event_field', 'local_variable')" syntax:

When it runs, I get the following:
e_time is a timestamp object but s_time is an ISO8601-formatted string. That's okay! When the values are sent to Elasticsearch, it will store both as timestamps. I don't have a use-case for searching these yet but while I'm debugging I have no incentive to remove them.
One decision I did make when I did this in my production clusters is to only apply the pipeline timing filters to events with a "pipeline_metric" tag. This allows me to only add the timestamps to select groups of logs (or for one of my sys-admins to tag the logs they're sending, should they decide to test processing time).
Wrapping Up
As I stated, X-Pack does a great job of showing general metrics - events received and sent by logstash, how much CPU and heap is being used by logstash or elasticsearch, how many events per second are being indexed by an Elasticsearch cluster (or node), etc - but it doesn't really help me evaluate how long it takes to process an event. Logstash offers an "elapsed" filter but that is only useful for the time that has elapsed between two log events, not since certain actions were taken against a specific event. This gives me a clean way to solve that issue.
More than just the system time is available to ruby. With multiple Logstash clusters, maybe it's good to know which ingest or processing node handled a given event - you can add this with:
event.set('node_name', Socket.gethostname)
If you combine that with time-based metrics, you suddenly have the ability to make *very* useful dashboards about which types of logs are taking the longest to process, which filters are taking the most time to run and which nodes have the highest (or lowest) processing time for those logs. It's pretty powerful stuff!


