16 April 2017

Beginning ELK Part Two: Getting Started With Logstash

Every indicator I've seen has pointed to ELK becoming EK for most users - where logstash as a transport isn't really needed because so many things can write directly to elasticsearch. Now that elasticsearch has the idea of an "ingest node", basically a lightweight processor for logs, the argument for a full-fledged logstash node (or nodes) isn't as important for most users who want to read and search logs without much parsing or without adding a lot of metadata.

I still like having logstash around, though. To me it's cleaner to push data to logstash than to try to configure elasticsearch with multiple pipelines (ingest nodes), and there are still filters/plugins that aren't implemented in elasticsearch. If you have network equipment that can speak syslog, logstash can ingest those and push them into elasticsearch. If you want to parse them in specific ways, and add or change certain fields, then send them to multiple storage locations, you want logstash. One example of this that I want to work on is sending to elasticsearch for short-term retention and S3 for long-term archival (since S3 can then transition to Glacier after <x> days; note also that elasticsearch can use S3 as a snapshot repository!).

An Act in Three Scenes


ELK, as a whole, can be thought of as a play in three acts. In the first act you read/receive/store data (logstash). In the second act you index and analyse the data (elasticsearch). In the third act you visualise the data (kibana).

If that's the case, I like to think of logstash (and its configuration file) as an act in three scenes - because it is broken up into three sections, each performing an important part in receiving and storing data.

Logstash (at least on Ubuntu, when installed through apt via the elastic repository) comes without a configuration file. If you have installed via the method at Beginning ELK Part One, you had an empty configuration directory. I'm starting with a fresh installation via the same instructions and /etc/logstash/conf.d/ is an empty directory:


Scene One: Input


The first section in a logstash configuration is the "input" section. This is where you tell logstash how to receive your data. There are all manner of ways to read data. Some of the more familiar ways may be via the syslog protocol or from a local file, but there are some pretty exotic (at least to me!) ways to read data. For example, you can configure logstash to read from an S3 bucket, from CloudWatch, by an HTTP POST and from message queuing  systems like redis, zeromq, rabbitmq and kafka. The list of input plugins recognised by Elastic can be found here: 


Note not all of them are supported by Elastic!

The one I'm going to start with is "stdin". This is really useful for debugging because you can type out a log entry or paste a few lines from a log without having to configure logstash to read that log file. Since I do a lot over SSH, it's nice to be able to copy a few lines of a log from one box and test it with a logstash instance configured for stdin. If you aren't familiar with "standard in"/"stdin" and "standard out"/"stdout", that's okay! In general "standard in" means from the command line or keyboard and "standard out" means to the display.

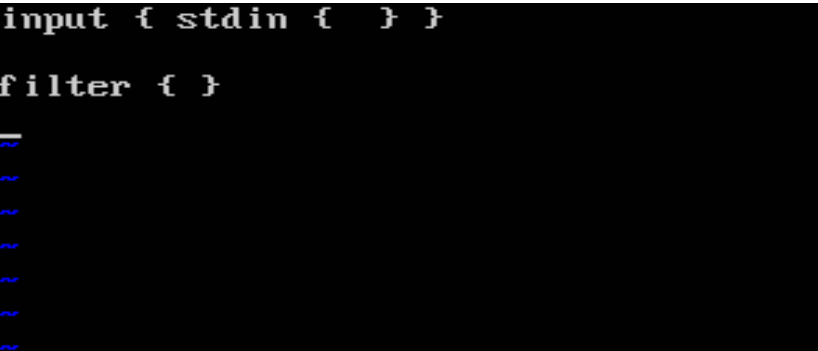
Any file in /etc/logstash/conf.d/ will be read as a configuration file. To get started, I want to add a file called "intro.conf" and I'll add in "input" section with a type of "stdin":


Scene Two: Filter


I use ELK with Bro *a lot*. By default, the "originating IP" for a connection is knows as id.orig_ip. That's great, except the "." is kind of special in elasticsearch and it doesn't like having fields with a dot in their name -- so I use logstash to change that, on the fly, to an underscore. I do this in the "filter" section.

For now let's have our "filter" section be empty. We can come back to it in just a bit, once we've seen how all of the parts of the logstash configuration file work together.

Scene Three: Output


The "output" section is where you tell logstash where you want it to send your data. This is where you'd tell logstash how to connect to your elasticsearch nodes, your S3 bucket, maybe to syslog to send to a massive syslog cluster for long-term archival or maybe to Splunk if something in the data matched a specific criteria. For our needs, though, I want to keep things as simple as possible. Since we're reading data in from standard in/stdin, let's push it to standard out/stdout (remember, stdout is generally the display).

There is ONE option I want to set in the output section, other than to send the output to stdout. Logstash has a wonderful debug codec you can use that shows you exactly how logstash parses your data. It's called the rubydebug codec and it makes learning how logstash does stuff a lot easier (or it did for me!).


Why am I using screenshots instead of pasting the actual config lines here? Because most people learn better by doing than by reading :)

With that saved, I can start up logstash from the command line and test my configuration.

First Test - Hello, World!


Even though logstash won't be started (this time) as a service, it still requires permission to write to certain areas that my demo user can't write - so it has to be started with sudo.

On Ubuntu, installed from the Elastic repository with apt, the logstash binary lives at /usr/share/logstash/bin/logstash. It has to know where the configuration is with "--path.settings" and, to make things easy, I'll just have it use the rest of the settings found in the /etc/logstash directory.

That means the entire command looks something like this:

sudo /usr/share/logstash/bin/logstash --path.settings /etc/logstash

Once it's started, you should get a prompt asking for data (it can take a minute for everything to start, don't worry if you don't get any output immediately):


At this point, anything you type will be parsed as input and SHOULD be returned back to you in the way logstash knows how to parse it. For example, if you type "Hello, World!", you should get something back like this:


The Output


Okay, let's talk about the output for just a second. Instead of breaking the data provided into "Hello" and "World!", logstash treats that as a single message (as it should, it was the message you gave to logstash!). However, it also added a couple of pieces of metadata around the message, such as the timestamp on the system when logstash received the message.

This timestamp business (technical phrase, I promise) is important because if you receive a log entry with a timestamp in it, logstash will *by default* add a metadata field called "timestamp" but it will be the timestamp *when it was received by logstash*, not the timestamp in the message. Try it with the running logstash instance and see!


Don't worry, you can add your own field for the timestamp when the data was received via a filter (but we're not going to do that in this post - just know you can).

To stop logstash, hit Ctrl+C.

JSON Input


In my last couple of posts I had written some scripts to generate some sample log data and the output is in JSON. If you're not familiar with JSON, that's okay, I only having a passing familiarity with it myself. The short version is that it pretty much looks like a CSV only it has key/value pairs so you aren't left wondering what everything is and a single JSON object is surrounded by curly braces.

I like JSON because I think it's readable (it's also fairly portable!), but there's a big win with JSON if you're using ELK. You can tell logstash to parse your data as JSON adding a codec option to the stdin input type, like so:


Now I can feed logstash data formatted as a JSON object and it will do something interesting. For example, For example, I'm writing this on 16 April 2017 - the 271st anniversary of the Battle of Culloden. I can give it the following input:

{"ts":"1746-04-16T11:00:00.0000+00:00","event.type":"battle","event.location":"Culloden"}

Since that's a valid object in JSON, logstash parses it like so:


Notice logstash separates the data into its key/value pairs! Instead of writing a parser, or a big grok statement, to read "1746-04-16T11:00:00.0000+00:00 battle Culloden", I can save a lot of work by giving logstash JSON directly. I work a lot with Bro logs so I configure Bro to output in JSON and updating OSSEC so I can take advantage of its JSON output is high on my list.

For that matter, you can even write system logs in JSON via native log software in Linux! A HOW-TO for syslog-ng can be found here:


and a HOW-TO for rsyslog can be found here:


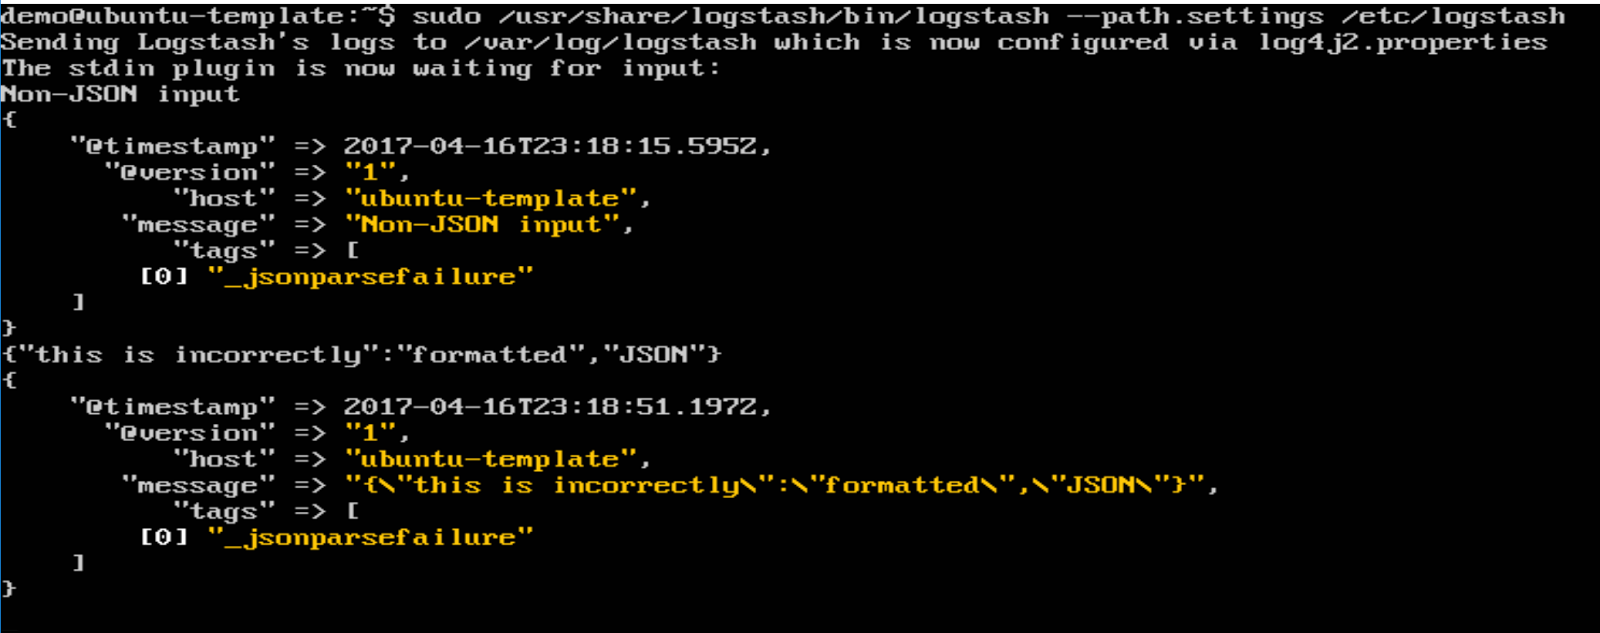
What about if you give it non-JSON input or invalid JSON? Logstash will throw an error, identifed by "_jsonparsefailure":

Back to Filter


Let's go back to the filter section for a really common use of filters - renaming fields in log data. Above, I have fields named "event.type" and "event.location". Elasticsearch wouldn't like that very much and I'm not entirely certain I like having the "." in there. What if I wanted to rename the fields to "event_type" and "event_location" but I don't have access to the application that creates the logs? Logstash can do that on the fly! In all fairness, so can elasticsearch, but that's another post...

Logstash does this with the "mutate" filter. The actual option is, helpfully enough, named "rename", and it's used to rename fields. The format for rename is:

rename => { "old_name" => "new_name" }

Mutate also lets you do things like add and remove fields or adding/removing tags that can be used for additional filtering or custom output locations later on. The full documentation for "mutate" can be found here:


Since I want to rename two fields, I need two rename statements. I've also taken a little time to make the input/output sections read a bit more like the filter section -- it's okay, that's just formatting in the configuration file and doesn't affect the performance at all. After my changes, the new configuration looks like this:


Now, if I feed logstash the same data as above, I get this:


Wrapping Up


Logstash is a powerful log-o-matic tool for slicing, dicing and enriching logs before pushing them to some storage engine. It supports reading data from and writing data to a wide variety of locations. Sure, some of the functionality is built in to elasticsearch now - for example, you can rename fields with elasticsearch before it stores/analyses the data - but I still like it and think it has its place (for example, if you're consuming logs from sources that only speak syslog).

11 April 2017

Generating Sample Log Files Part Two: Do It In Python


I didn't really like the run time of my bash script, and I really want to dig some more into python (meaning expect me to do it wrong *a lot*), so I re-wrote it in python.

I also changed a few things...

Some Additions


The script I started with only writes something that looks like a proxy log - but sometimes you want more than just one type of log. For the python version, I've added a "dns" type that make something that looks a bit like passive DNS logs and I've added a stub for DHCP-style logs.

I've also added an option to let me decide, at invocation, how many days I want logs for. There is no error checking - creating logs for 3000 days may fill your hard drive with log files. Don't do that. Use small numbers like 1 and 2 until you see how much disk they use.

The one big thing I want to work on is the "consistent" option. Ideally I'd like to have a DHCP entry for <foo> MAC address that creates <foo_two> DNS log by visiting a given site that generates <foo_three> proxy log. Right now everything is pseudo-random - that's great for analysing individual log types but rubbish for creating a large volume of cohesive logs of multiple types.

As with everything, it's a work in progress...

Change in I/O


The existing script just redirected output to a file -- if it existed then it deleted it and started a new one, so you were always guaranteed "fresh" data. While I have a need for a file that changes every few seconds, I also want to be able to create a big log file in a short amount of time. To that end, I've changed how the python script writes.

Instead of opening the file, appending one line and then closing it, the python script is a bit more efficient. It batches the writes in groups of 10,000 - so it opens the file once, collects ten thousand lines of log in RAM, writes out those ten thousand, clears the variable, collects another ten thousand, etc., then closes the log when it finishes.

Did It Help?


The bash script took approximately three hours to run. That's not an inconsequential amount of time to have to wait just to have a month's worth of log file to pump into Splunk, ELK, GrayLog2 or whatever.

The python script, by comparison, can write 30 days of logs in 45 seconds (actual time measured using "time ./createLogs.py --days 30 --proxy" is 42.9 seconds!). That's a HUGE difference in wait-time! I had time to cook *and eat* supper while the first script ran. I can't put the kettle on and be back before the python script finishes!

Show Me The Code!


Like I said, I am a complete newbie in python. I've hacked a few scripts together to do some basic things I've needed and this certainly falls in the category of "hacked together"! This is my first foray into time and arrays in python so some things are done in weird ways to help me grok how things work. All of that said, you're more than welcome to it. You can find it here:

https://github.com/kevinwilcox/samplelogs

Notice that has a link to both scripts, in bash and python, and while they'll both *run* at the time of code commit, I make no promises that they'll do anything they're supposed to do. User beware, I'm not responsible if they bork something on your system, they're freely offered without support under the BSD 3-clause licence, etc.

04 April 2017

Generating Sample Log Files

As I work on ELK posts (and even on a couple of upcoming Splunk posts), I've realised I have a significant problem: I don't really have a good set of log data that I can use as an example for doing interesting things with ELK. This left me with a couple of options. Either I could install some server software and generate a lot of requests over several weeks or I could script something that created a month or two of logs in a few minutes.

Well that is a pretty easy decision!

I'm not going to go through the script I wrote to generate the sample data. Instead, I'm going to talk a little bit about the script and its output and then provide a link to the script at the end.

Make Life Easy, Use JSON


This could start a text-format Holy War but I'm going to make an executive decision, from the start, to use JSON. It may not be as compact as something like BSD syslog or CSV but I think it is easily readable, it's still easy to parse with cut/awk and you don't need to run it through a grok pattern in logstash to push it to ELK - you can just dump it directly into elasticsearch! I'm going to use JSON.

My Key/Value Pairs


I wanted to have a log that would be *similar* to something you may find, that could let me do one or two interesting things in ELK (and later in Splunk) and that would be simple to read. I opted for a log that may be similar to a web proxy log. Therefore, I decided on the following fields (keys):

1. timestamp - this is in ISO-8601 format (and in UTC)

2. ip_address - this is the IP address of the system making the request; I have six possible IP addresses:
  • 10.10.10.1
  • 10.10.10.3
  • 10.10.10.8
  • 10.10.20.2
  • 10.10.20.5
  • 10.10.20.13
3. username - this is the user authenticated with the proxy; I have seven users:
  • alvin
  • simon
  • theodore
  • piper
  • prue
  • pheobe
  • paige

4. site - this is the URL being requested; I have four sites:
  • https://www.bbc.co.uk
  • https://www.bbc.com
  • https://www.google.com
  • https://www.cnn.com

To make things interesting, any user may have any IP at any time. That means piper may request https://www.bbc.co.uk from IP 10.10.20.13 and one second later simon may request https://www.cnn.com using the same IP.

A Note on BASH


Bash isn't my favourite shell and it isn't my favourite scripting language but it truly is Good Enough for a lot of things, including this. To really get an idea of what you can do with it, I recommend perusing the "Bash Guide for Beginners" at The Linux Documentation Project:


The Overview


The script itself does the following:

o establish arrays for users, sites and IPs
o get the current time
o get the time from one month ago (this is arbitrary)
o write one log entry for each second between those two times (appends to a log file via stdout redirection)

A Sample Entry


What does this look like in the actual log? Here's a sample entry:

{"timestamp":"2017-03-28T01:37:54+00:00","ip_address":"10.10.10.1","username":"paige","site":"https://www.bbc.co.uk"}

Again, I chose this format because the key/value pairs mean you can look at a single entry and never have to guess what any field is. One of the best things I did for my Bro logs, where I may need to give exports to people who don't read Bro every day, is start outputting in JSON format!

Wrapping Up


To generate (in my VM) the two million-ish log entries I want to use took about two and a half hours.

There are certainly more efficient mechanisms BUT I also want to do some things in the future with reading log files that change (for example, having logstash or filebeat read from an active log file), so this fits both needs at the loss of speed, elegance and correctness (there are certainly better ways to write to a file in bash than using output redirection after every line!!).

Sometimes you just don't want to run through all of the setup necessary to generate a lot of log data. Sometimes you DO want to but don't have the hardware available (and don't want to spin up a bunch of systems at AWS or Azure). When that happens I think it can be perfectly fine to script something that generates sample log data, just know it can take some work to get there!

The script I used can be found here:

https://raw.githubusercontent.com/kevinwilcox/samplelogs/master/createProxyLogs.sh

26 February 2017

Beginning ELK Part One: A Single VM

My road to ELK was long and winding. Let's just say I was very anti-ELK for a very long time but, over the last year, that opinion has changed *significantly*, and now I am one of the biggest ELK supporters I know. The unification work done by Elastic, the addition of granular permissions and authentication, the blazing query response time over large data sets and the insight provided by the beats framework have really won me over.

But don't take MY word for it.

The VM


To make things simple, I want to start my ELK series on an Ubuntu virtual machine. It's well-supported by Elastic and you can use apt for installation/updates, so it uses the native package manager.

This is a pretty basic VM, I've just cloned my UbuntuTemplate VM. 4 CPUs, 4GB of RAM and 10GB of disk. While it is NOT what I'd want to use in production, it is sufficient for tonight's example.

If you're saying, "but wait, I thought the UbuntuTemplate VM only had one CPU!" then yes, you're correct! After I cloned it into a new VM, UbuntuELK, I used VBoxManage to change that to four CPUs:


Next I needed to increase the RAM from 512MB to 4GB. Again, an easy change with VBoxManage!


Then I changed the network type from NAT (the default) to 'bridged', meaning it would have an IP on the same segment of the network as the physical system. Since the VM is running on another system, that lets me SSH to it instead of having to use RDP to interact with it. In the snippet below, "enp9s0" is the network interface on the physical host. If my system had used eth0/eth1/eth<x>, I would have used that instead.


The more I use the VirtualBox command line tools, the happier I am with VirtualBox!

I didn't install openssh as part of the installation process (even though it was an option) because I wasn't thinking about needing it so I DID have to RDP to the system and install/start openssh. That was done with:

sudo apt-get install ssh
sudo systemctl enable ssh
sudo systemctl start ssh

Then I verified it started successfully with:

journalctl -f --unit ssh

Dependencies and APT


As I said, you can install the entire Elastic stack -- logstash, elasticsearch and kibana -- using apt, but only elasticsearch is in the default Ubuntu repositories. To make sure everything gets installed at the current 5.x version, you have to add the Elastic repository to apt's sources.

First, though, logstash and elasticsearch require Java; most documentation I've seen use the webupd8team PPA so that's what all of my ELK systems use. The full directions can be found here:

http://www.webupd8.org/2012/09/install-oracle-java-8-in-ubuntu-via-ppa.html

but to keep things simple, just accept that you need to add their PPA, update apt and install java8.

sudo add-apt-repository ppa:webupd8team/java
sudo apt-get update
sudo apt-get install oracle-java8-installer

Since Java 9 is currently available in pre-release, you'll get a notice when you add their repository. When you do the install you'll get a prompt to accept the Oracle licence. There is a lot that happens with the above three commands so don't be surprised when you see a lot of things happen after each one.

Now for the stack! You can go through the installation documentation for each product at:

https://www.elastic.co/guide/en/logstash/current/installing-logstash.html
https://www.elastic.co/guide/en/elasticsearch/reference/current/deb.html
https://www.elastic.co/guide/en/kibana/current/deb.html
First, add the Elastic GPG key (note piping to apt-key just saves the step of saving the key and then adding it):

wget -qO - https://artifacts.elastic.co/GPG-KEY-elasticsearch | sudo apt-key add -

Now add the Elastic repository to apt (alternatively you can create a file of your choosing in /etc/apt/sources.list.d and add from 'deb' to 'main' but I like the approach from the Elastic documentation). This is all one command:

echo "deb https://artifacts.elastic.co/packages/5.x/apt stable main" | sudo tee -a /etc/apt/sources.list.d/elastic-5.x.list

Update apt:

sudo apt-get update

Now install all three pieces at once:

sudo apt-get install logstash elasticsearch kibana

I had about 170 MB to download so it's not exactly a rapid install!

Now make sure everything starts at startup:

sudo systemctl enable logstash
sudo systemctl enable elasticsearch
sudo systemctl enable kibana

Make Sure It All Chats


By default, logstash doesn't read anything or write anywhere, elasticsearch listens to localhost traffic on port 9200, kibana tries to connect to localhost on port 9200 to read from elasticsearch and kibana is only available to a browser on localhost at port 5601. Let's address each of these separately.

elasticsearch

Since elasticsearch is the storage location used by both logstash and kibana, I want to make sure it's running first. I can start it with:

sudo systemctl start elasticsearch

Then make sure it's running with:

journalctl -f --unit elasticsearch

The last line should say, "Started Elasticsearch.".

kibana

Kibana can read from elasticsearch, even if nothing is there. Since I need to be able to access kibana from another system, I want kibana to listen on the system's IP address. This is configurable (along with a lot of other things) in "/etc/kibana/kibana.yml" using the "server.host" option. I just add a line at the bottom of the file with the IP of the system (in this case, 192.168.1.107):


Then start it with:

sudo systemctl start kibana

You can check on the status with journalctl:

journalctl -f --unit kibana

I decided to point my browser at that host and see if kibana was listening as intended:


So it is! This page also indicates elasticsearch can be reached by kibana, otherwise I'd see something like this (again, this is BAD and means elasticsearch can't be reached!):


logstash

For testing, I want an easy-to-troubleshoot logstash configuration. The simplest I can think of is to read in /var/log/auth.log and push that to elasticsearch. To do that, I added a file called "basic.conf" to /etc/logstash/conf.d/ (you can name it anything you want, the default configuration reads any file put in that directory). In that file I have:

input { file { path => "/var/log/auth.log" } }
filter { }
output { elasticsearch { hosts => ["localhost:9200"] } }

This says to read the file "/var/log/auth.log", the default location for storing logins/logouts, and push it to the elasticsearch instance running on the local system.

On Ubuntu, /var/log/auth.log is owned by root and readable by the 'adm' group, but logstash can't read the file because it runs as the logstash user. To remedy this I add the logstash user to the adm group by editing /etc/group (you can also use usermod).

With the config and group change in place, I started logstash:

sudo systemctl start logstash

Then I checked kibana again:


Notice the bottom line changed from 'Unable to fetch mapping' to 'Create'! That means:

  • logstash could read /var/log/auth.log
  • logstash created the default index of logstash-<date> in elasticsearch
  • kibana can read the logstash-<date> index from elasticsearch

Now I know everything can chat to each other! If you click "Create", you can see the metadata for the index that was created (and you have to do this if you want to query that index):


The First Query


Now that I've gone through all of this effort, it would be nice to see what ELK made of my logfile. I technically told logstash to only read additions to the auth log so I need to make sure it gets something - in my terminal window I typed "sudo dmesg" so that sudo would log the command.

To do a search, click "Discover" on the left pane in kibana. That gives you the latest 500 entries in the index. I got this:


Notice this gives a time vs. occurrence graph that lets you know how many items were added to the index in the last 15 minutes (defaults). I'm going to cheat just a little bit and do a search for both the words "sudo" and "command" since I know sudo commands are logged with the word "command" so I replace '*' with 'sudo AND command' in the search bar (the 'AND' is important):


The top result is my 'dmesg'; let's click the arrow beside of that entry and take a better look at it:


The actual log entry is in the 'message' field and indeed the user 'demo' did execute 'sudo dmesg'! One of my favourite things about this entry is the link between the entry and the Table version -- this link can be shared with others so if you search for something specific and want to send someone else directly to the result, you can just send them that link! 

Wrapping It Up


This is a REALLY basic example of getting the entire ELK stack running on one system to read one log file. Yes, it seems like a lot of work, especially just to read ONE file, but remember - this is a starting point. I could have given logstash an expression, like '/var/log/*.log', and had it read everything - then query everything with one search.

With a little more effort I can teach logstash how to read the auth log so that I can do interesting things like searching for all of the unique sudo commands by the demo user. With a little MORE effort after that, I can have a graph that shows the number of times each command was issued by the demo user. The tools are all there, I just have to start tweaking them.

I do get it, though, it can seem like a lot of work the first few times to make everything work together. A friend of mine, Phil Hagen, is author for a SANS class on network forensics and he uses ELK *heavily* - so heavily that he has a virtual machine with a customised ELK installation that he uses in class. He's kind enough to provide that VM to the world!


He has lots of documentation there and full instructions for how to get log data into SOF-ELK. I've seen it run happily with hundreds of thousands of lines of logs fed to it and I've heard reports of millions of lines of logs processed with it.

18 February 2017

Headless VirtualBox Part Three: Bring on the Clones!

Today I wanted to work on a logstash grok statement and kibana dashboard for nmap output and, eventually, Qualys scans. The idea was that I wanted to have a dashboard that let me see any new hosts discovered on the network in the last twenty-four hours, new services that showed up on existing systems and new services on the network period.

That's great, I just need several VMs to scan and show up on the network. Since I recently made the FBSDTemplate VM, I can just clone it out. I did that on my headless Ubuntu system...but that's okay, because as it turns out, VirtualBox lets you clone VMs on the command line!

And, to no Unix or Linux user's surprise, it's faster than cloning via the GUI.

list


In the GUI you get a pretty pane that has a list of all your VMs. To see those at the command line is a simple command:

VBoxManage list vms

When you list your VMs, you get both the "name" of the VM and the ID of the VM. You can use either of these when using the VBoxManage command -- I like using the name because I don't have to copy/paste it.

Notice I have two VMs:


You can also show only your running VMs with:

VBoxManage list runningvms

clonevm


In the GUI you'd need to select the VM you want to clone, use the hot-key or right-click and choose "Clone", then follow dialogues about whether you want to do a full or linked clone, whether you want to change the MAC address for network cards, etc.

Cloning at the command line, though, is a single command!

If I want to clone FBSDTemplate to a new DHCP and DNS server called FBSDNetworkServices, I can do that in one step. By default it will change the MAC address *and* create a full clone! When I created my clone I used the "--register" option so VirtualBox would be immediately aware of it.

VBoxManage clonevm FBSDTemplate --name FBSDNetworkServices --register

That's it, job done! All that's left is to start it.

Here is everything I did, start to finish:


The entire process, start to finish, took about thirty seconds *and I could do it over SSH*. I realise I'm coming late to the party, that tons of people have been using VBoxManage to do SSH-based management of headless VirtualBox servers for years. As with everything that's "old hat", there are always people being introduced.

That's where I am with VBoxManage and, on the whole, I'm chuffed to bits!

17 February 2017

Headless VirtualBox Part Two: Scripting the Setup

In January I posted about using the VirtualBox command line tool "VBoxManage" to make a new virtual machine on a headless system (https://opensecgeek.blogspot.com/2017/01/creating-remote-virtualbox-vm-with-ssh.html). Doing that for each one you want to make, though, gets tiring. It's a lot easier to script the process.

A few years ago I sat through a forensics class with a brilliant lad named Kevin. You can check him out at https://techanarchy.net. While our SANS instructor was telling a story about an experience he had with shadow copies, Kevin wrote a python script that searched a disk image for shadow copies and mounted each one into its own directory. By the end of the next break he'd added error checking and various other tidbits. That is not the depth of script I'm prepared to write.

Instead, I am content with a basic shell script that has some constants declared and then uses those to create a new VM.

Something Simple - Using What I Already Know


What I came up with was this:


In Plain Text


The text version (in case someone wants to cut/paste/edit) is:

#!/bin/sh

VBOX_CMD=/usr/bin/vboxmanage

VM_NAME=FBSDTemplate
VM_TYPE=FreeBSD_64 
MEM_SIZE=128 
HD_SIZE=10000
HD_FILE="VirtualBox VMs/$VM_NAME/$VM_NAME.vdi" 
RDP_PORT=3389

INST_FILE=FreeBSD-11.0-RELEASE-amd64-disc1.iso

echo Creating VM
$VBOX_CMD createvm --name $VM_NAME --ostype $VM_TYPE --register

echo Creating HD
$VBOX_CMD createhd --filename "$HD_FILE" --size $HD_SIZE

echo Adding IDE Controller
$VBOX_CMD storagectl $VM_NAME --name "IDE Controller" --add ide --controller PIIX4

echo Attaching HD
$VBOX_CMD storageattach $VM_NAME --storagectl "IDE Controller" --port 0 --device 0 --type hdd --medium "$HD_FILE"

echo Attaching DVD
$VBOX_CMD storageattach $VM_NAME --storagectl "IDE Controller" --port 0 --device 1 --type dvddrive --medium $INST_FILE

echo Setting RDP Port
$VBOX_CMD modifyvm $VM_NAME --vrdeport $RDP_PORT

echo Enabling RDP
$VBOX_CMD modifyvm $VM_NAME --vrde on

echo Setting Memory Size
$VBOX_CMD modifyvm $VM_NAME --memory $MEM_SIZE 
echo Powering on VM
$VBOX_CMD startvm $VM_NAME --type headless
Basically, I just took the steps from my previous post about headless VirtualBox and replaced the VM info with constants. Note that this script creates a VM with a 10GB hard drive and 128MB of RAM. That is fine for FreeBSD but if you create an Ubuntu Server VM you want at least 512MB of RAM or the installer may fail. Guess how I know...

Now if I want to roll out an Ubuntu VM I can just make sure I have the install ISO, edit a few constants at the top, run the script and the new VM is ready for installation and listening for a VRDE connection on port 3389.

You can get the above script with:

git clone https://github.com/kevinwilcox/vbox

Sample Output


When it runs, it looks a lot like this (notice I've changed the VM name from FBSDTemplate to OpenSecGeekScript):


Quick and easy!

In Closing


A more sophisticated script has its appeal - it would be nice to run a command and have it prompt for the VM name, a selection from a list of supported OS types, the amount of RAM, the hard disk size and even the ISO to use for installation. Perfect is the enemy of the good and, in this case, this is good enough for me. Well, it's good enough for a first run!

05 February 2017

Preparing a Drive With Secure Erase

DISCLAIMER: THIS POST DEALS WITH PERMANENTLY ERASING DATA FROM A DISK DRIVE. IF YOU DO THIS, YOU DO IT AT YOUR OWN RISK. THIS IS A DANGEROUS SET OF OPERATIONS THAT CAN LEAVE YOUR DISK DRIVE UNUSABLE OR, AT THE VERY LEAST, DESTROY YOUR DATA. I AM NOT RESPONSIBLE IF YOU DESTROY YOUR DRIVE OR LOSE YOUR DATA.


American Football and The Super Bowl: Cleaning is More Interesting


Millions of people in the US today are getting ready to watch the Super Bowl. I don't particularly care about American Football, I'm much more of a rugby and, recently, hockey fan, and it looks like my region went straight from summer to spring so I thought I'd do a bit of cleaning today.

Which really means I started moving the Ubuntu system I have had on the desk in my living room and promptly got sidetracked.

In my last post I looked at setting up VirtualBox on that system so I could run some VMs without using the SSD in my laptops (despite my Windows 10 laptop having a separate 1TB spinning disk where I store the VMs...). Whilst moving the system today one of the side panels came off and I was reminded that I have two hard drives in that computer, one 250GB SSD and one 300GB with spinning platters, and I realised I've sort of gone about things all wrong.

I really like VMWare for virtualisation and they GIVE you their hypervisor; the Ubuntu system is currently headless and I use my laptops and table for everything, why not run their hypervisor on that system?

This is the problem with when I start to clean...I always get sidetracked on tech tangents. My train of thought went something like this:
I have a system where I want to install VMWare
That system has a spare drive I want to use
Drive re-use is pretty common
People make the mistake of thinking "deleted" means "gone"
I wonder how long a secure erase would take on that old drive

hdparm


There are several tools that support the "SECURITY ERASE UNIT" command but this drive is already in a Linux system and hdparm is available -- and hdparm supports functions like placing a drive in High Security mode and secure erase. That's not to say it will always be successful - I've heard people talk about having it fail and secondhand reports of people saying THEY have "heard reports of it failing" - but I have yet to have a drive report it successful and then recover anything from the drive.

Best part - it is only two commands (but don't expect it to go quickly...)!

DISCLAIMER: I REPEAT, IF YOU DO THIS, YOU DO IT AT YOUR OWN RISK. THIS IS A DANGEROUS SET OF OPERATIONS THAT CAN LEAVE YOUR DISK DRIVE UNUSABLE OR, AT THE VERY LEAST, DESTROY YOUR DATA. I AM NOT RESPONSIBLE IF YOU DESTROY YOUR DRIVE OR LOSE YOUR DATA.


First, enable High Security mode by setting a password for the drive. In this case I'm going to use the password 'something' (my drive is /dev/sdb):

sudo hdparm --user-master u --security-set-pass something /dev/sdb

Note that once a password is set the drive can ONLY be used by entering the password. That means if you reboot the system YOU CAN NOT ACCESS THE DATA ON THAT DRIVE without entering the drive password.

Then kick off the secure erase:

sudo hdparm --user-master u --security-erase something /dev/sdb

When I did it on my Linux box, I also used "time" to see how long it took - since that was the question I really wanted to answer:

time sudo hdparm --user-master u --security-erase something /dev/sdb

On the actual system it looked like this:


So, about an hour and a half for it to run. Note this is a really old drive, a Maxtor 6V300F0, at least ten years old. On a modern SSD it can complete in seconds because it basically tells the drive to set everything to zero.

After finishing successfully, the password is automatically removed and the drive is in a clean, usable state.

Sum It Up


For years we have relied on "dd if=/dev/zero" to prepare a hard drive for reuse or when selling/donating a computer. It's not a 100% way to "wipe" the data from a hard drive but it's "good enough" in a lot of situations. In the same way, using something like BitLocker or FileVault2 to encrypt an entire drive, then reformatting the encrypted drive, can be "good enough".

It's not good enough, though, for drives that have sensitive data or for SSDs.

For those systems it's better to use something that can access all parts of the drive and that is designed, from the beginning, to actually erase the contents of a drive, regardless of filesystem, operating system or drive health (bad blocks, for instance). Commercial systems exist to do this but there is a viable alternative built into Linux. 

And, if you deal with PII or need to be absolutely certain, there are certified drive destruction companies out there that will turn your hard drive into confetti!

A New Year, A New Lab -- libvirt and kvm

For years I have done the bulk of my personal projects with either virtualbox or VMWare Professional (all of the SANS courses use VMWare). R...